Experience
Overview of user experience
The Experience Panel provides a high-level view of user satisfaction.
Displaying quantitative charts about:
- Good experience;
- Average experience;
- Frustrating experience.
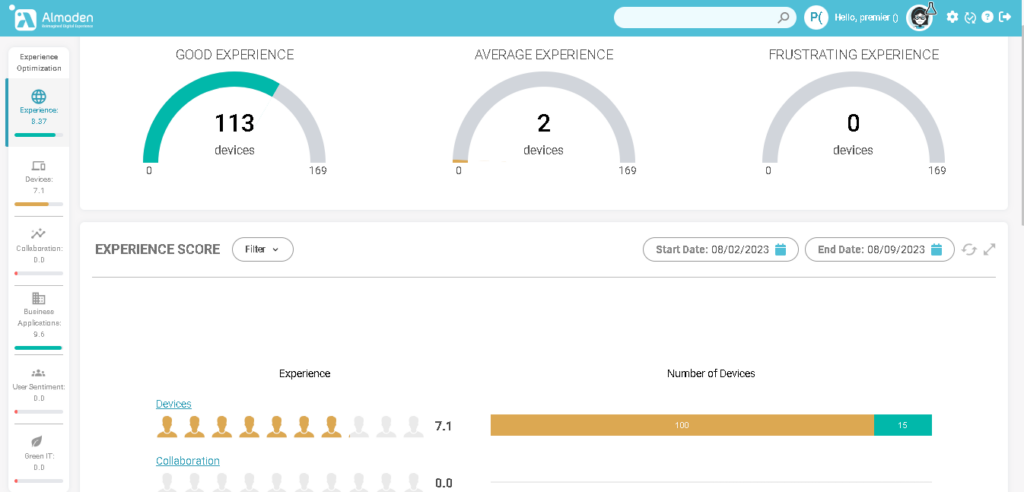
Detailed data is available by scrolling down to see the overall score and device scores over time.
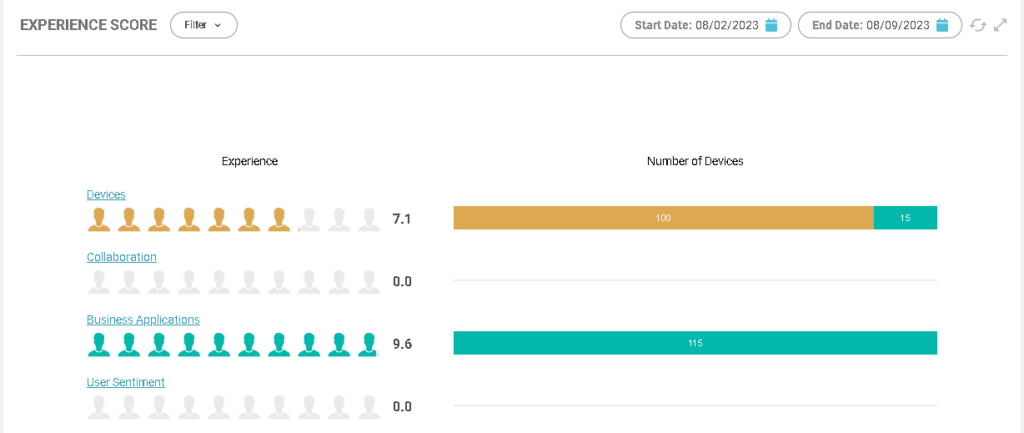
Overall Score
Scores Over Time
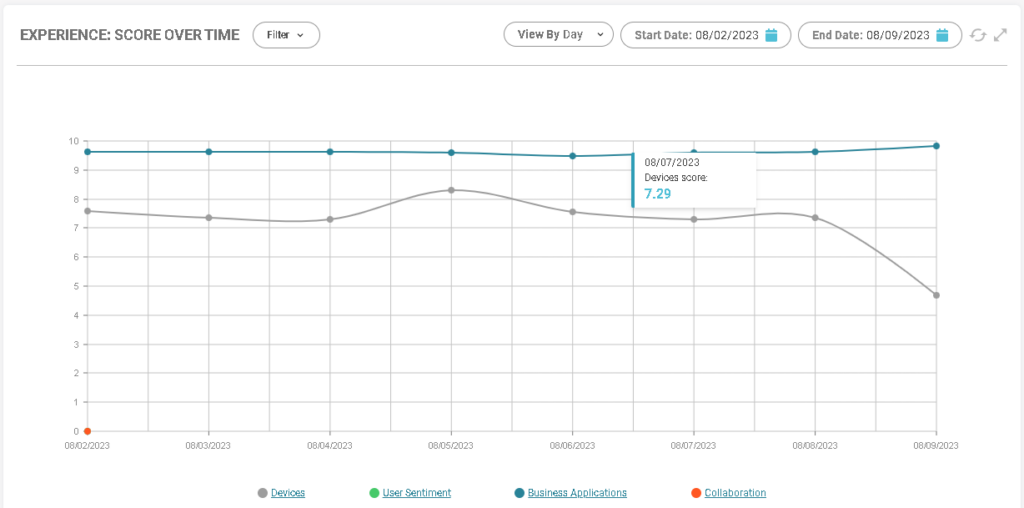
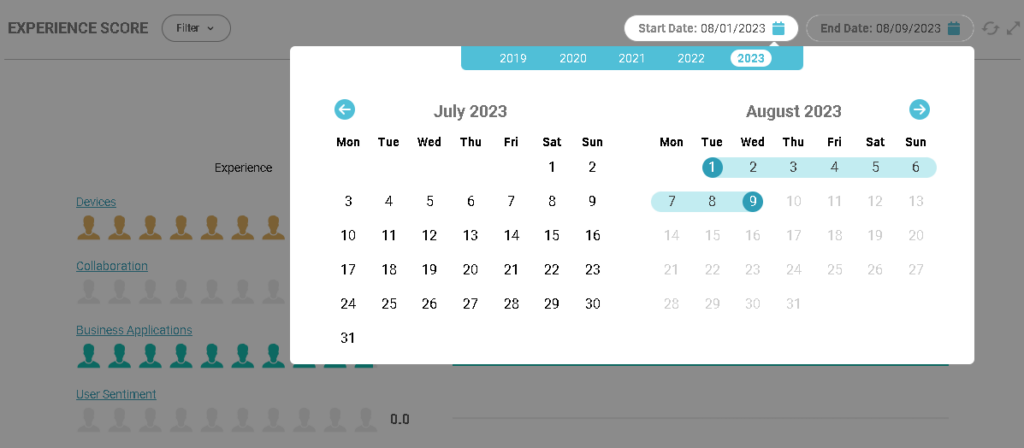
Some elements allow for deeper insights, as well as date range selection and result filtering.
These deeper insights include User Sentiment, Business Applications, Productivity, and Collaboration.
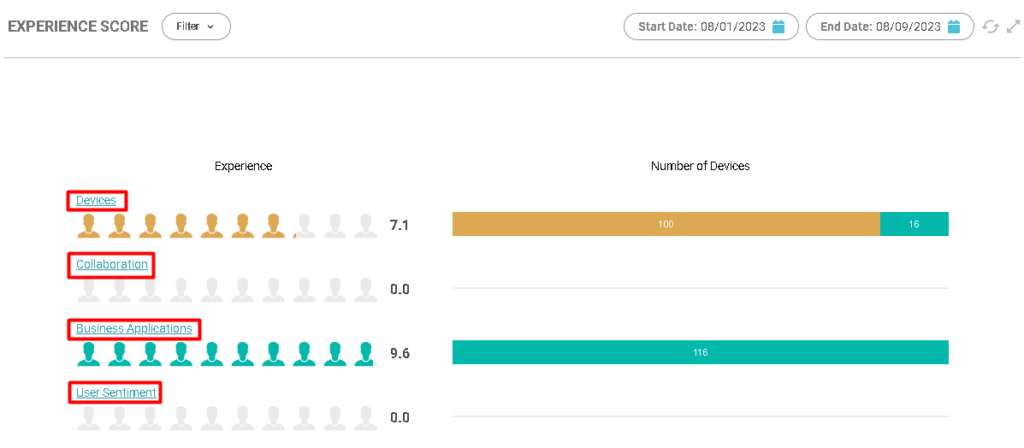
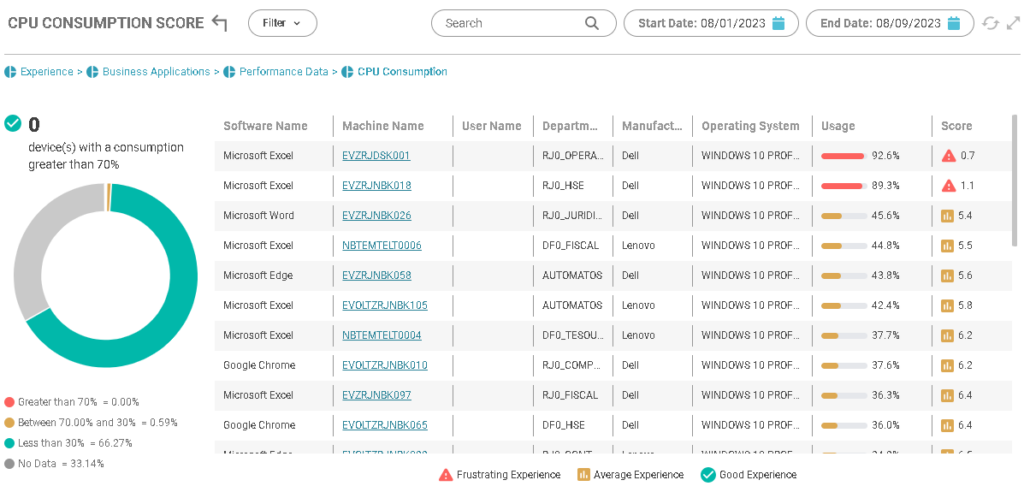
When clicking on the experience score options, additional views will be presented such as:
- Experience >Devices;
- Experience >Collaboration;
- Experience > Business Applications;
- Experience >User Sentiment.
Which can be expanded until they reach the level of machines.