Memory Usage
Memory Usage
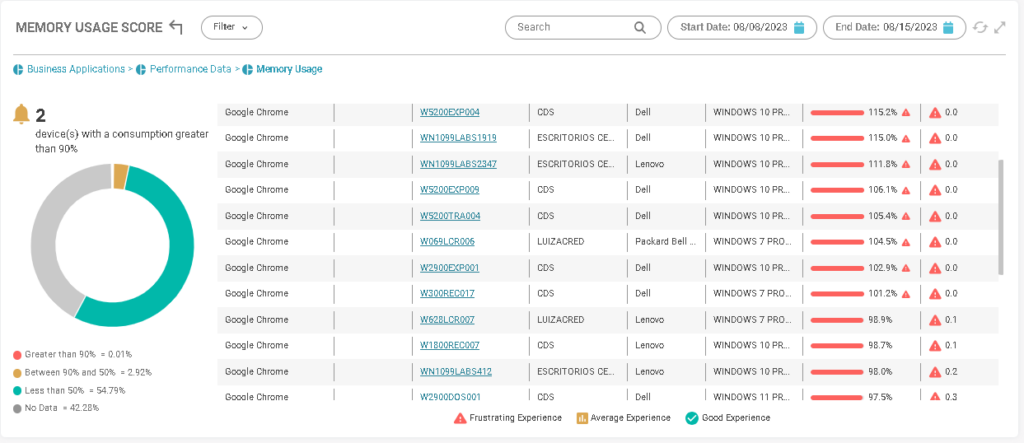
In the memory usage graph we can check the total and percentage of devices according to memory consumption:
- (Red) Greater than 90%;
- (Yellow) Between 50 and 90%;
- (Blue) Less than 50%;
- (Gray) No data.
Business Applications >Performance Data >Memory Usage
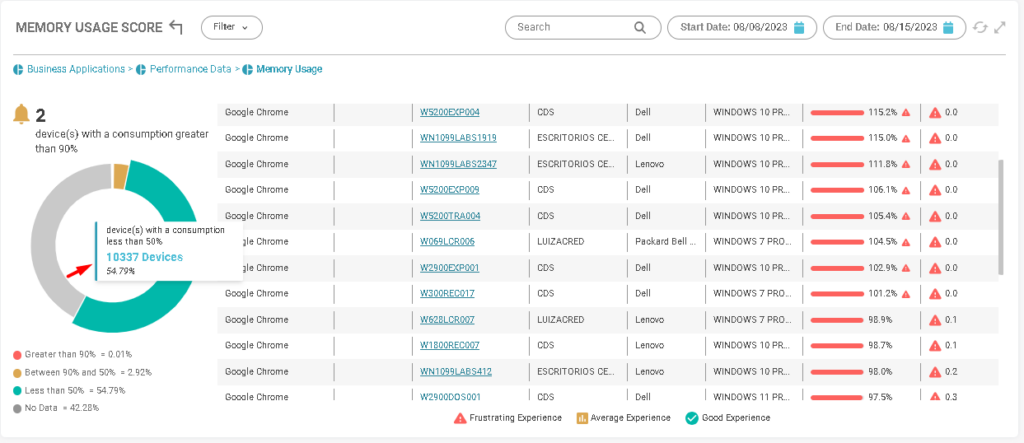
Mouse over the desired color to view total devices and percentage:
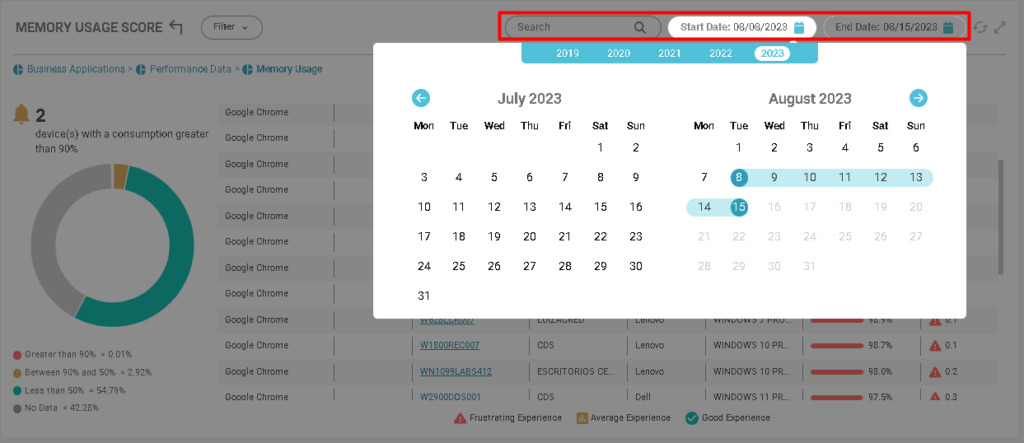
Filter by hostname or data periods:
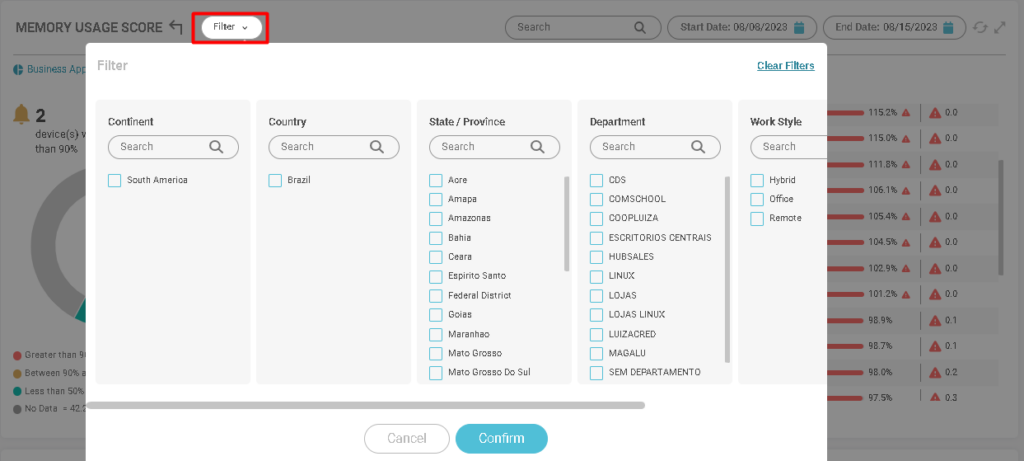
You can filter devices by:
- Continent;
- Country;
- State;
- Department;
- Work style;
- Operational system.