Wi-Fi
Wi-Fi
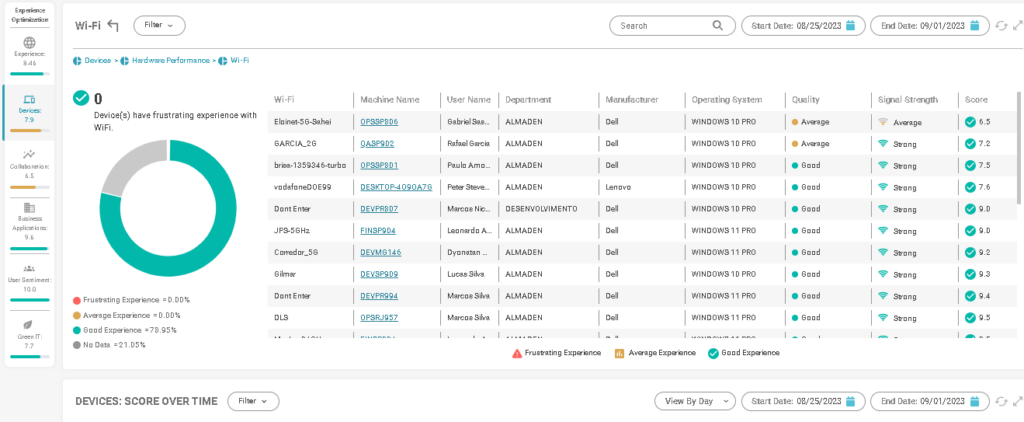
In this option it is possible to identify which Wi-fi network the device used according to the selected date.
In the last three columns we can check the quality of the signal, the strength of the signal and its score.
Dispositivos >Desempenho de Hardware >Wi-Fi
The total assets and percentage can be seen on the chart according to the colors, hovering the mouse over it.
- (Red) Frustrating Experience;
- (Yellow) Average Experience;
- (Blue) Bora Experience;
- (Gray) No Data.
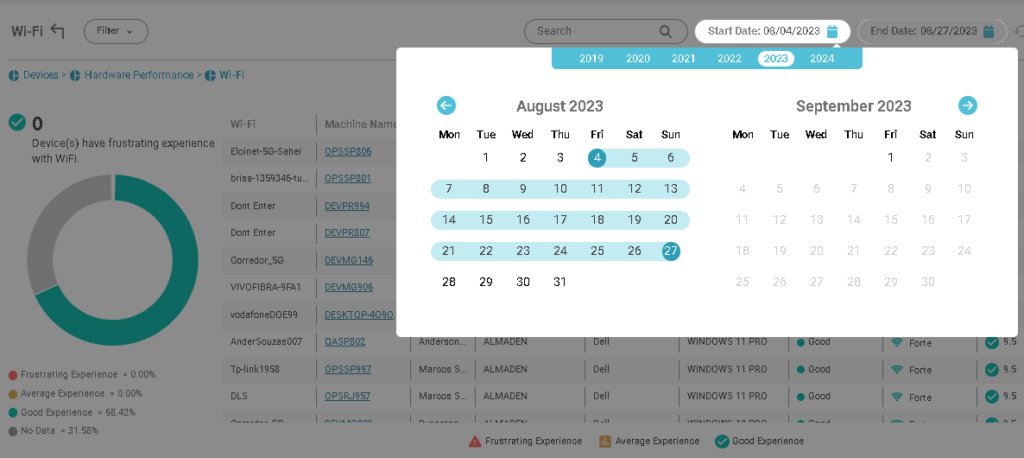
Use the data filter to view the collections according to the selected days.
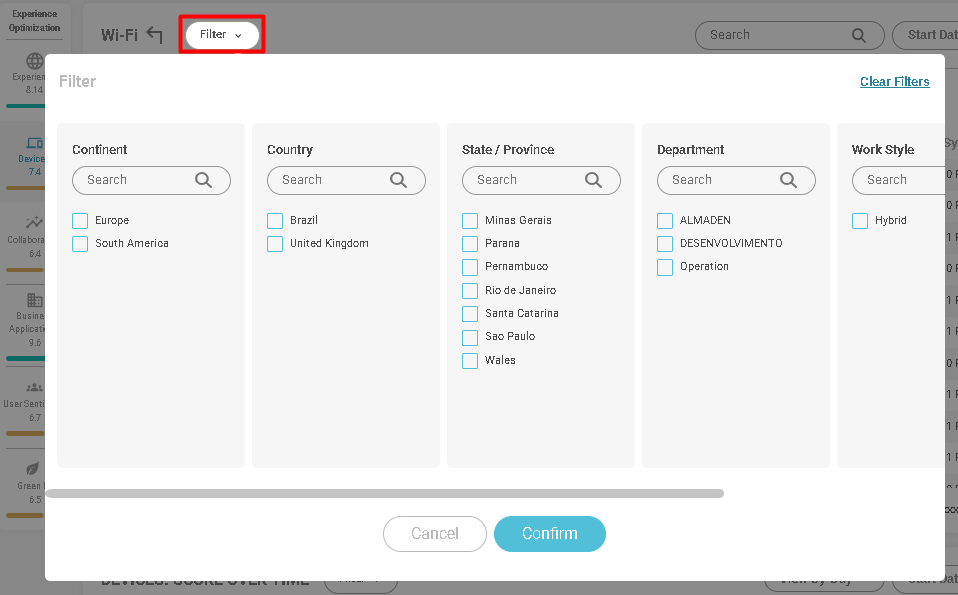
You can filter devices by:
- Continent;
- Country;
- State;
- Department;
- Work style;
- Operational system.
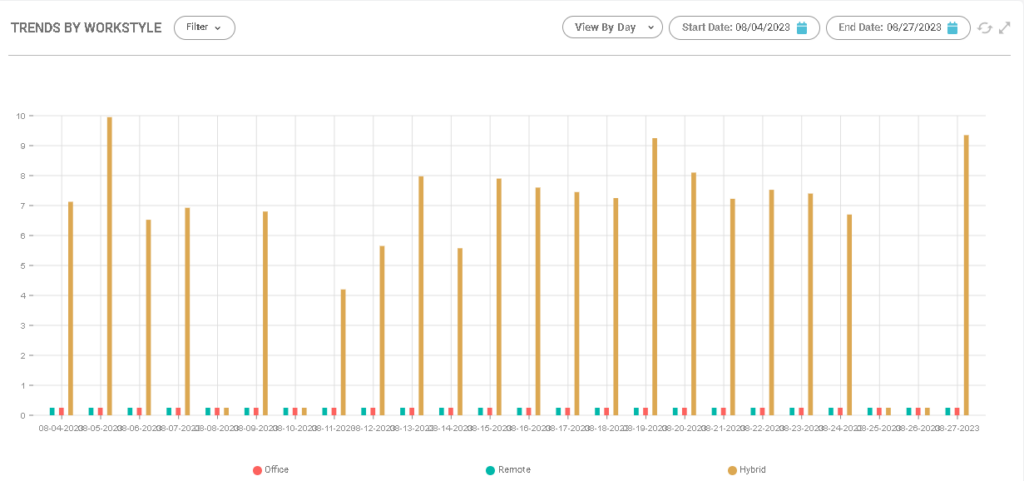
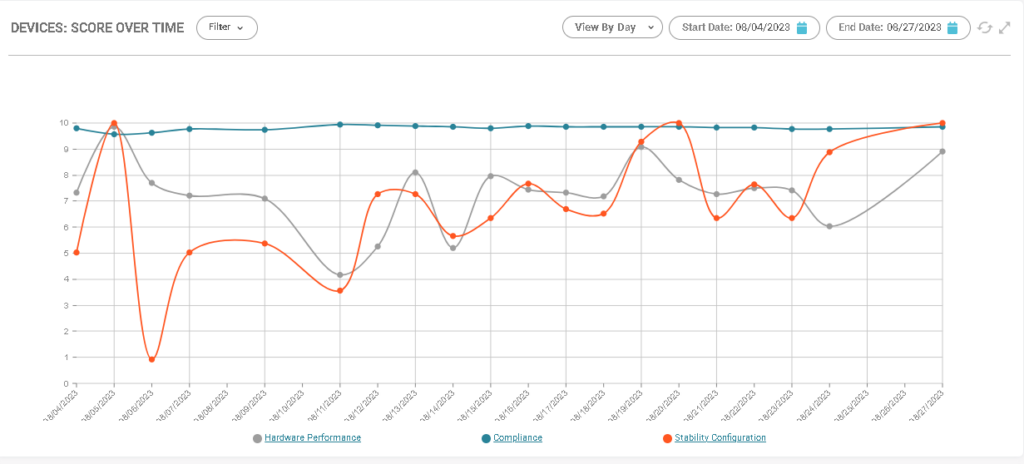
In the following graph you can see the graph of devices and their score over time.
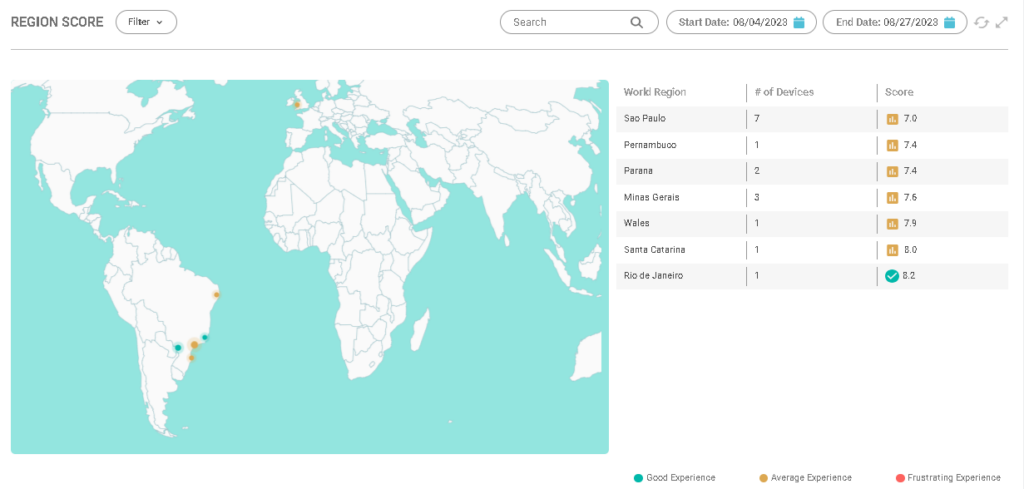
Score chart by region.
Score chart according to work style:
- (Blue) Remote;
- (Red) Office;
- (Yellow) Hybrid.