Energy Consumption
Energy Consumption
Through the power consumption graph, you can check the total number of devices by:
- Energy Consumption;
- Computer Shutdown .
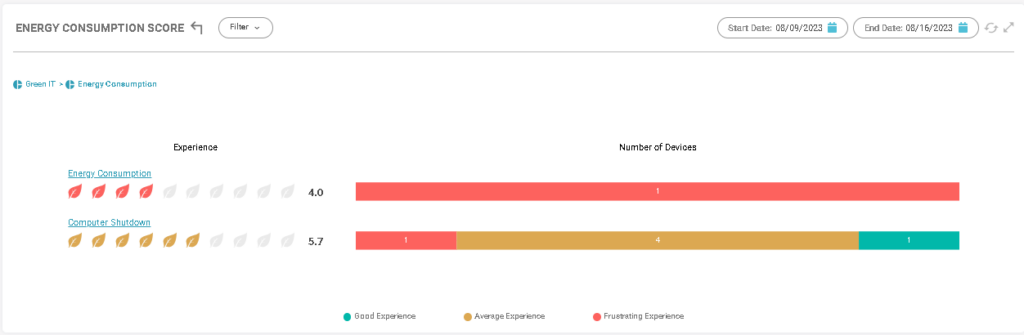
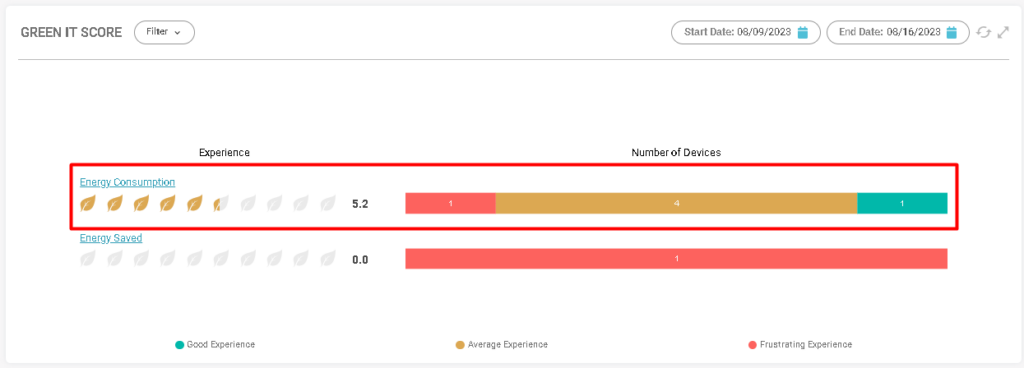
When clicking on the option: Energy consumption, the number of devices per energy consumption will be displayed according to the colors:
- (Blue) Good experience;
- (Yellow) Regular experience;
- (Red) Bad experience.
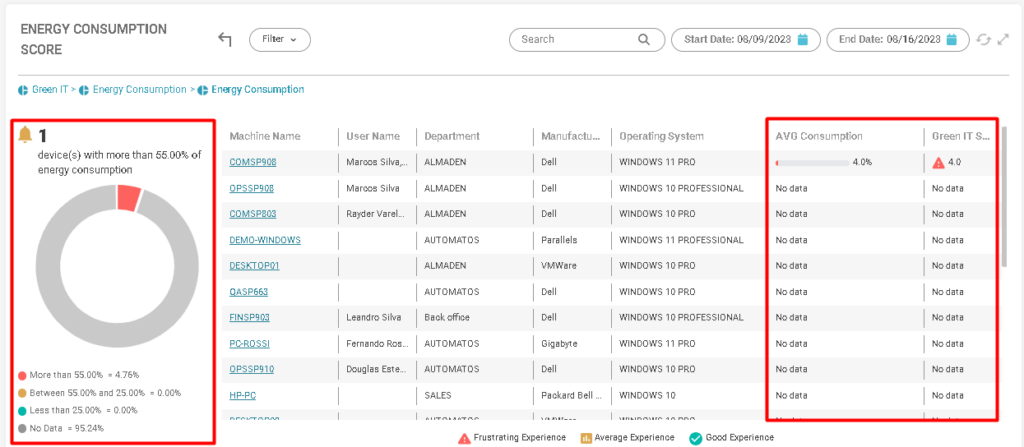
To reach the last level of the drill down, click again on the option: Energy Consumption to view all the devices presented in any consumption group created in SmartCenter.
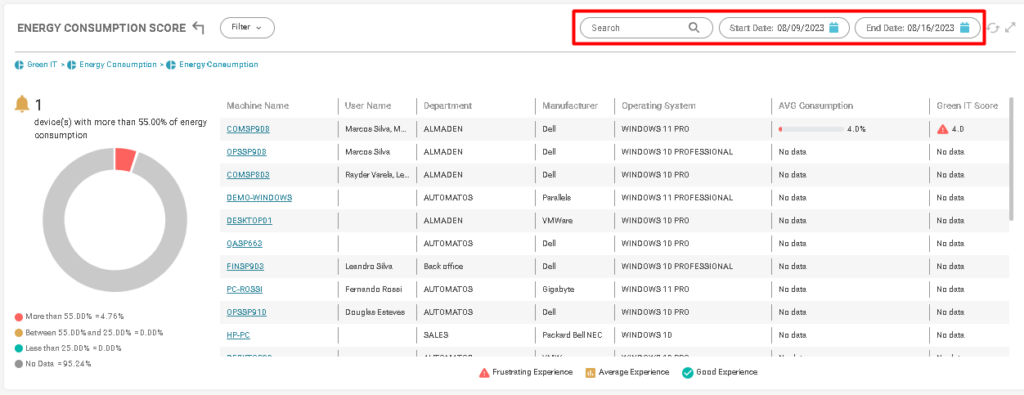
Observe the graph in the scoring conditions that can be seen in the last two columns. (Average consumption and Green IT score).
- (Red) More than 55%;
- (Yellow) Between 25% and 55%;
- (Blue) Less than 25%;
- (Gray) No data;
The lower the power consumption, the better the score.
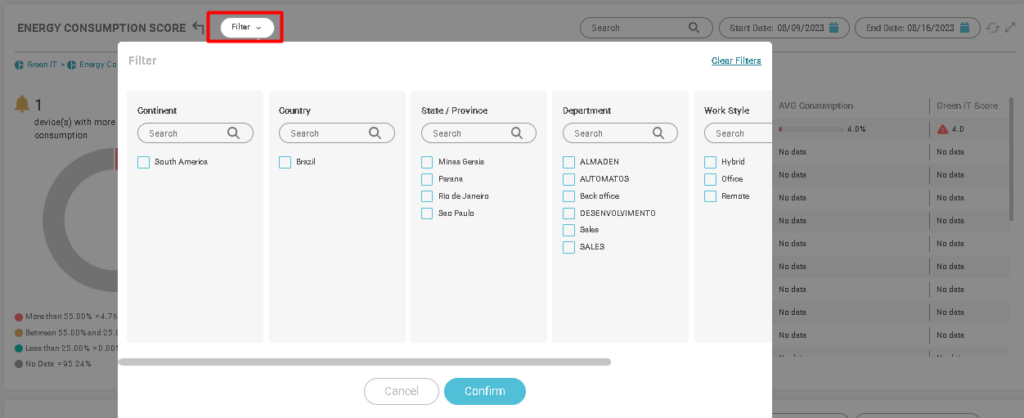
Filter by hostname or data periods:
You can filter devices by:
- Continent;
- Country;
- State;
- Department;
- Work style;
- Operational system.