Energy Saving
Energy Saving
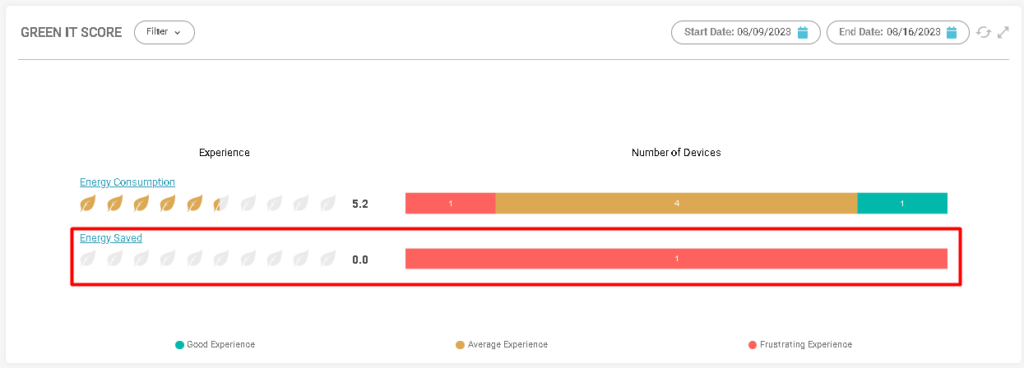
Using the energy saving chart, you can check the number and percentage of devices that save more or less energy.
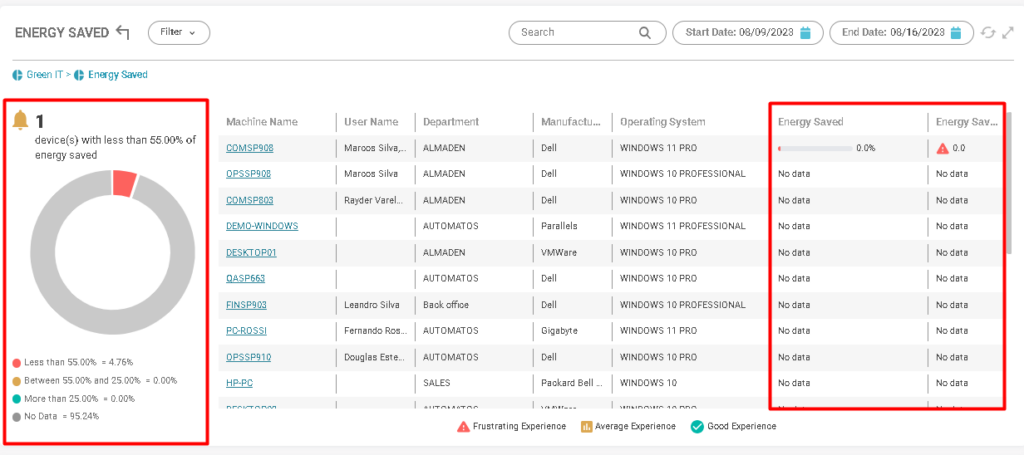
The device must be in a power management group created in SmartCenter to be part of this number of devices.
To reach the last level of the drill down, click on the option: Energy Savings to view all devices presented in any consumption group created in SmartCenter.
Look at the graph in the scoring conditions that can be seen in the last two columns. (Energy saving and energy saving score).
- (Red) Less than 55%;
- (Yellow) Between 25% and 55%;
- (Blue) Less than 25%;
- (Gray) No data;
The more savings, the better the score.
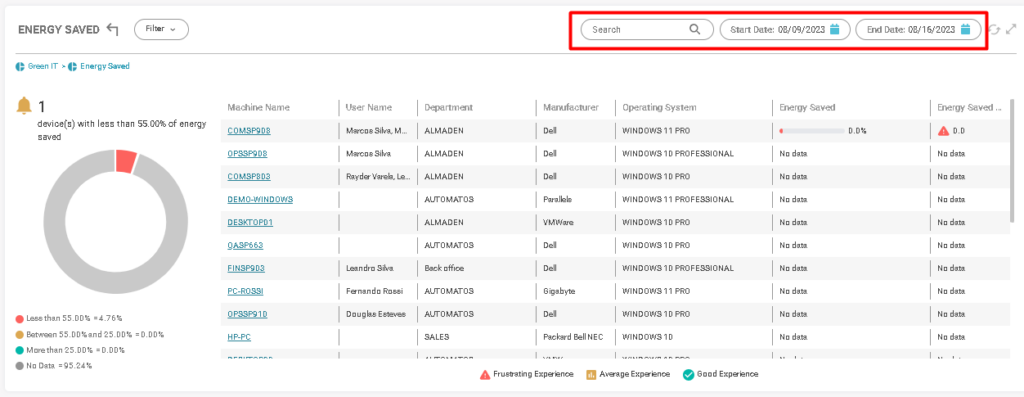
Filter by hostname or data periods:
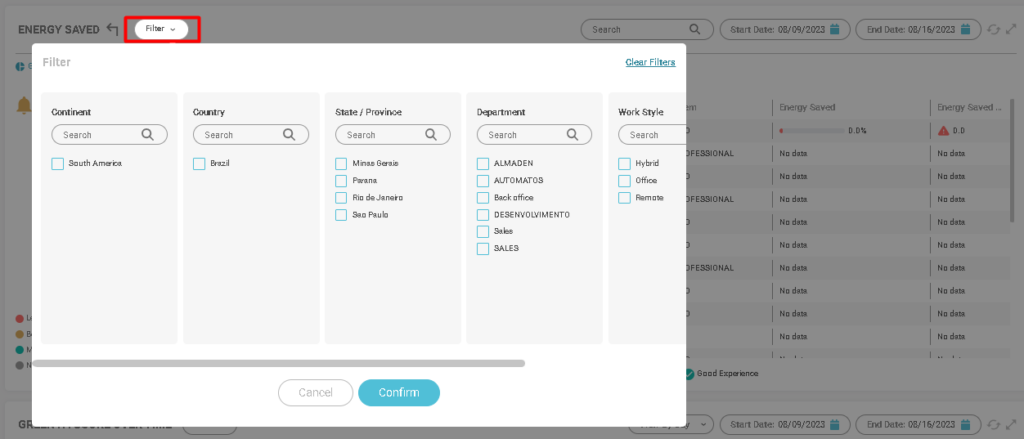
You can filter devices by:
- Continent;
- Country;
- State;
- Department;
- Work style;
- Operational system.