Green IT Dashboard
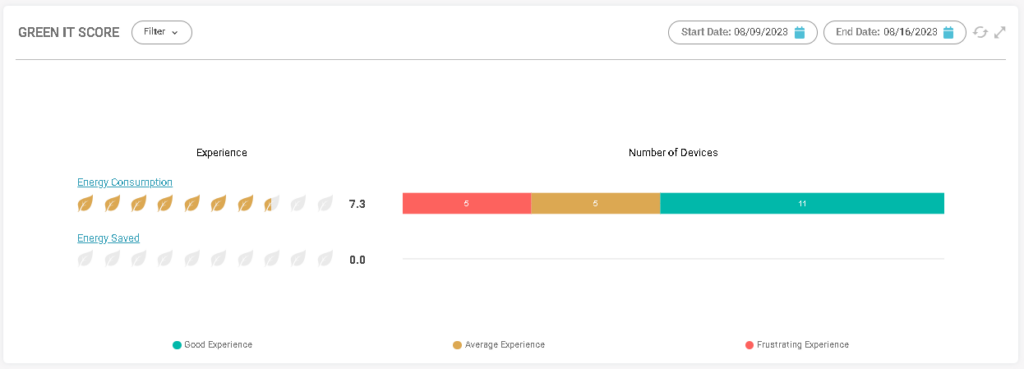
The Green IT Panel indicates energy consumption and computer shutdowns, with details and filtered views over time.
They are useful for understanding a company’s energy usage and to determine if users are complying with device shutdown policies.
The data are according to the settings made in SmartCenter.
- Green – Good experience;
- Yellow – Regular experience;
- Red – Bad experience.
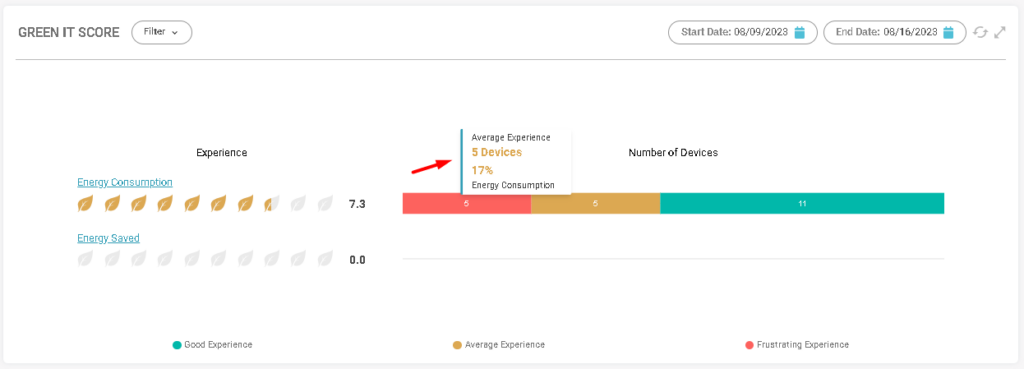
Mouse over the colors displayed in the graphs to view the total and percentage of devices according to energy consumption.
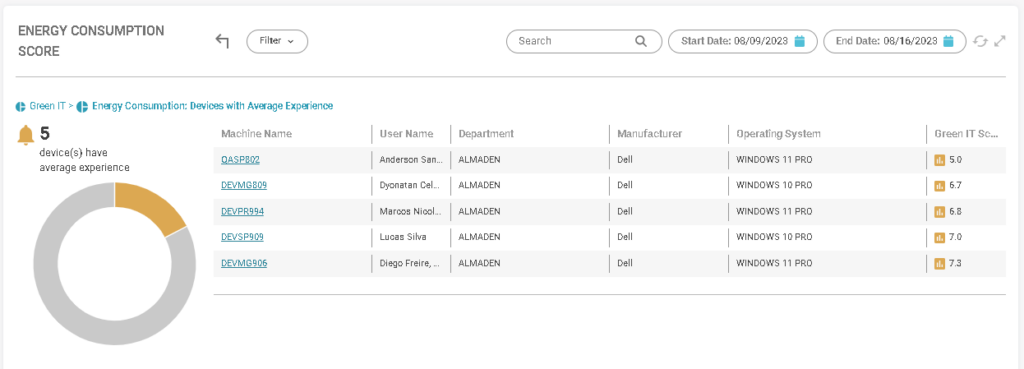
By clicking on the graph data, the referring devices will be filtered and the last column will show the score according to energy consumption.
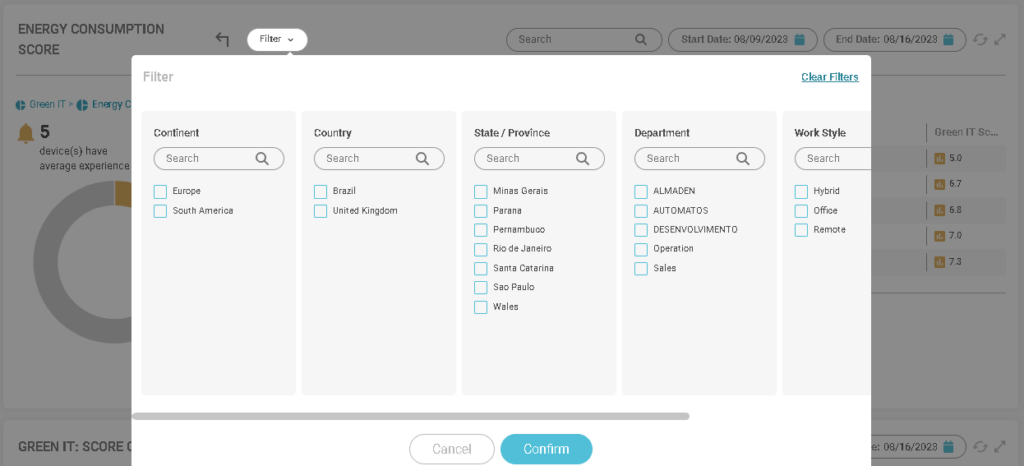
Filter by hostname or data periods:
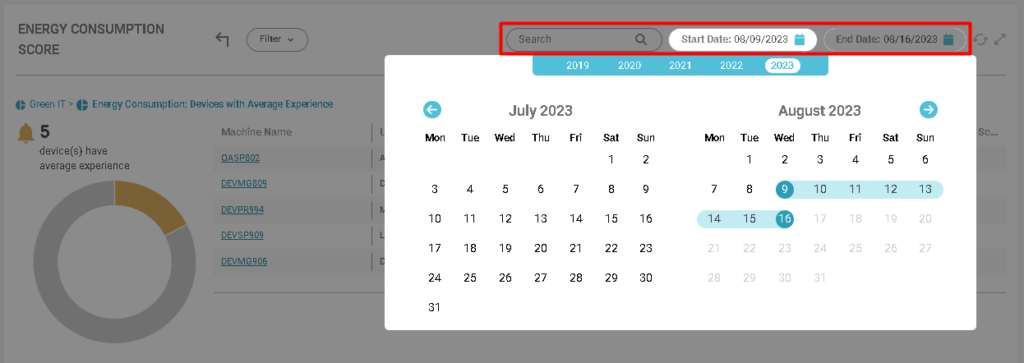
You can filter devices by:
- Continent;
- Country;
- State;
- Department;
- Work style;
- Operational system.