Data Performance
Data Performance
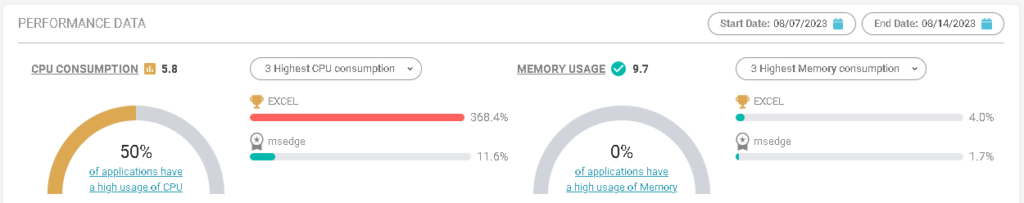
Under data performance, you can check which devices employees are having a frustrating experience in business applications that have been configured according to:
![Data Performance](https://docs.almaden.app/wp-content/uploads/2023/08/image-196-1024x443.png)
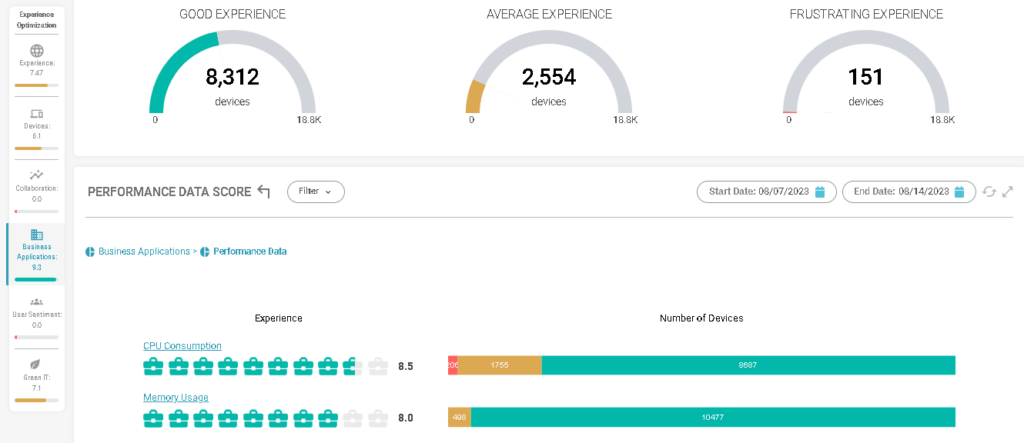
Click on the red part of the graph that represents a frustrating experience to list these devices.
The same can be done on the memory usage graph.
![image 197 Data Performance](https://docs.almaden.app/wp-content/uploads/2023/08/image-197-1024x344.png)
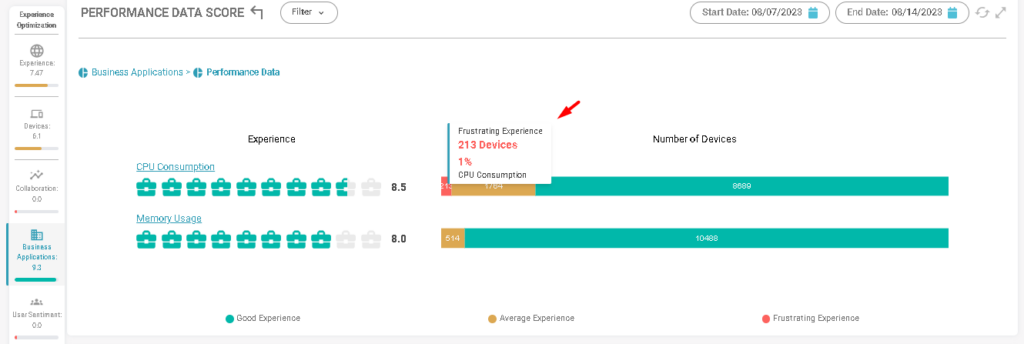
It will list the total devices that users are having a frustrating experience.
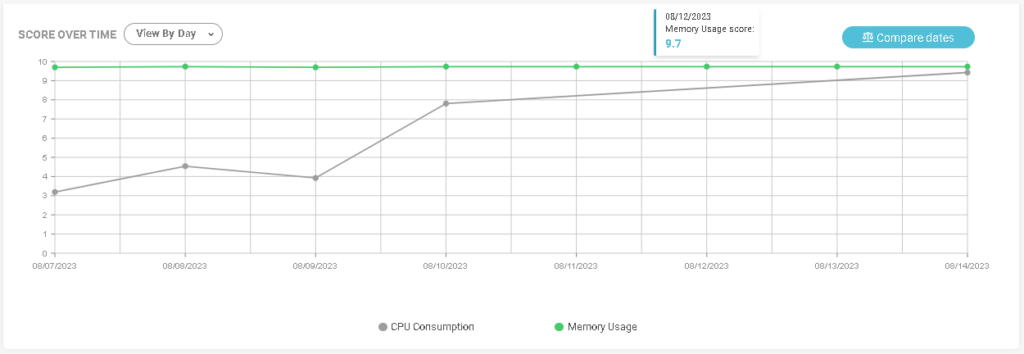
The last two columns display the CPU consumption and your score.
![image 198 Data Performance](https://docs.almaden.app/wp-content/uploads/2023/08/image-198-1024x382.png)
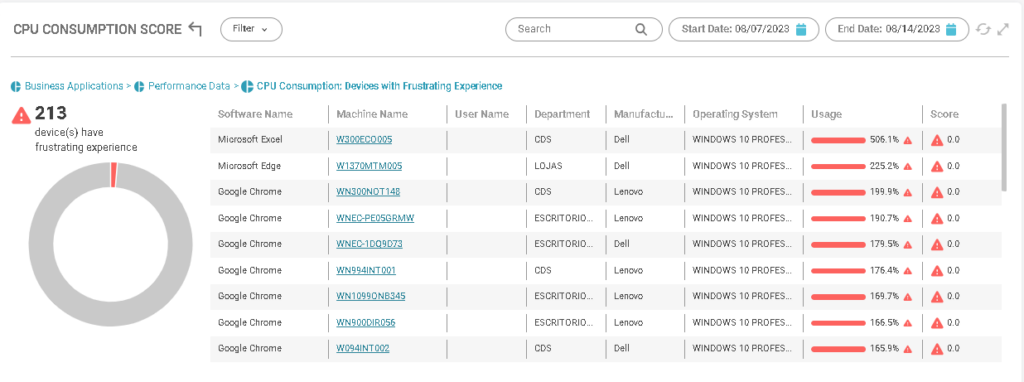
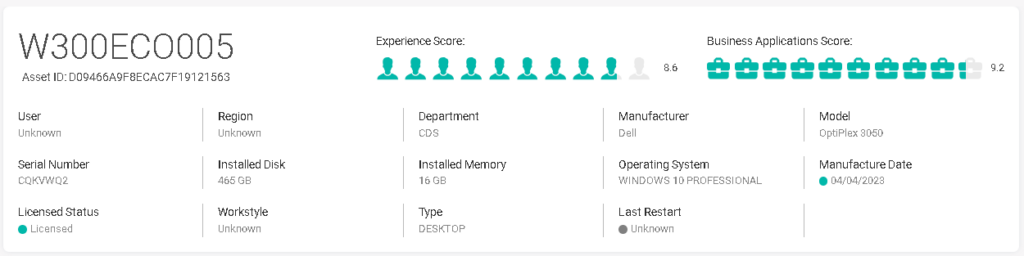
To view in detail by device, click on the hostname.
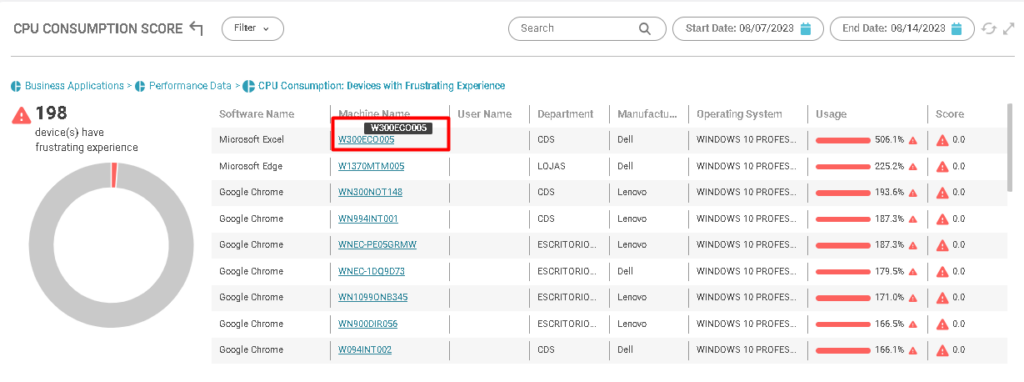
![image 199 Data Performance](https://docs.almaden.app/wp-content/uploads/2023/08/image-199-1024x382.png)
Device detail:
![image 204 Data Performance](https://docs.almaden.app/wp-content/uploads/2023/08/image-204-1024x256.png)
![image 207 Data Performance](https://docs.almaden.app/wp-content/uploads/2023/08/image-207-1024x203.png)
![image 208 Data Performance](https://docs.almaden.app/wp-content/uploads/2023/08/image-208-1024x354.png)
![image 209 Data Performance](https://docs.almaden.app/wp-content/uploads/2023/08/image-209-1024x471.png)