Application errors
Application errors
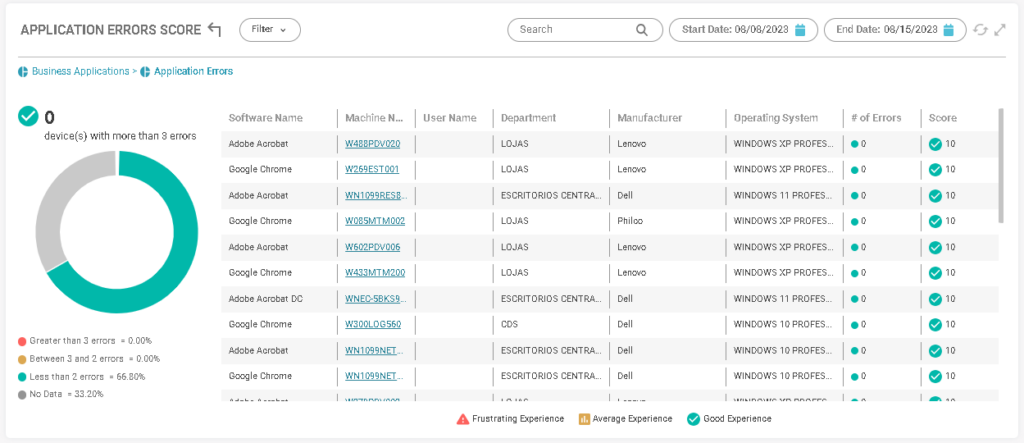
In the availability of business applications, it is possible to verify in the last two columns the quantity and the percentage of errors occurred in the applications defined as essential for the development of the work of the employees.
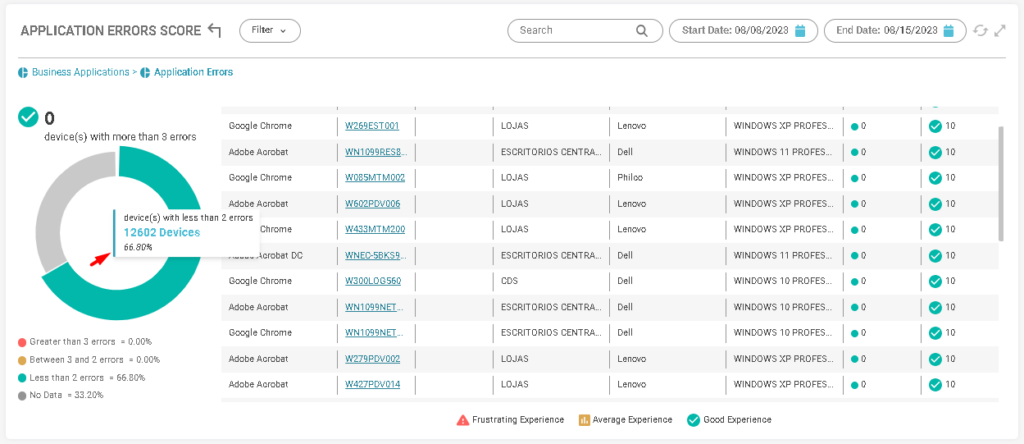
In the graph we can see the total and percentage of errors that occurred:
- (Red) More than 03 errors;
- (Yellow) Between 02 to 03 errors;
- (Blue) Less than 02 errors;
- (Gray) No data.
Business Applications >Application Errors
In the graph we can see the total and percentage of errors that occurred:
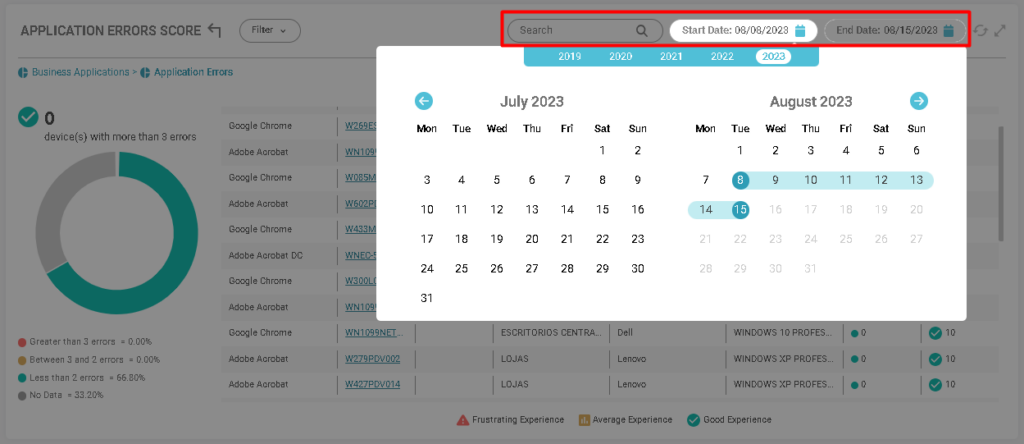
Filter by hostname or data periods:
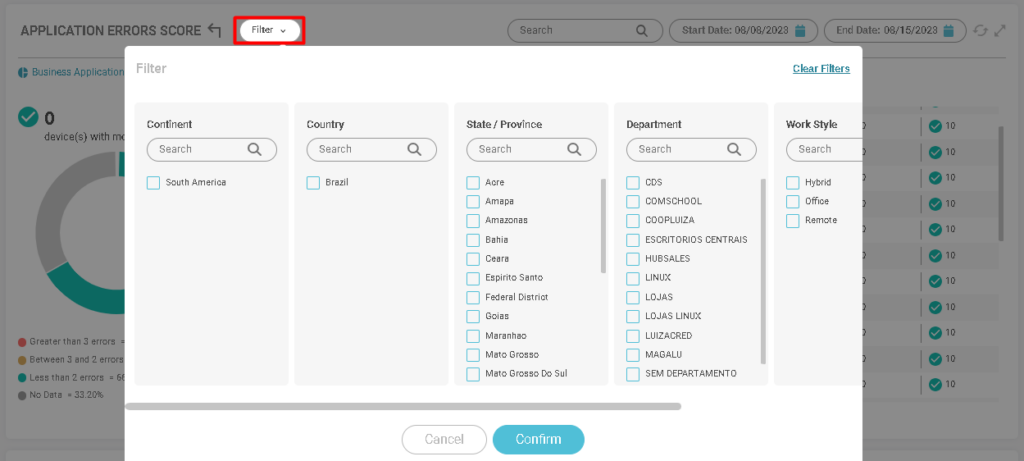
You can filter devices by:
- Continent;
- Country;
- State;
- Department;
- Work style;
- Operational system.