
Machine Downtime
Device Downtime
Know exactly which devices are off the radar and take action before the problem grows.
The Device Downtime feature automatically identifies which devices are not communicating with the platform within a period you define. This means any equipment that is offline, inactive, or with the agent stopped will be listed for your analysis.
Ideal for environments with many devices, this module helps to:
- Detect devices that are turned off or out of operation
- Check for possible monitoring agent failures
- Identify network or power issues
- Support preventive and corrective actions
Keep your infrastructure visible, up to date, and functional with this powerful control feature.
Menu> Inventory> Reports> Device Downtime
How to set up device downtime schedules:
Step 1 – Device type
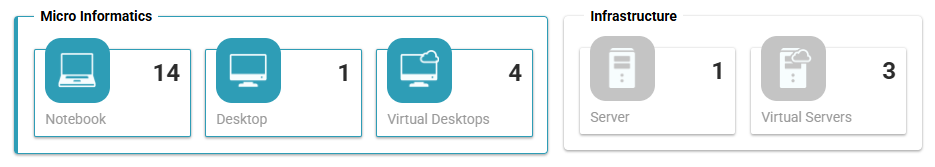
Select by category “Microinformatics”, “Infrastructure”, or by device type.
Step 2 – Scale and time
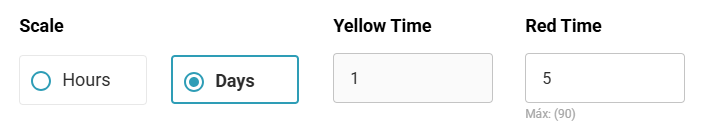
Define the time scale.
- Scale
- Hours: Set times for yellow and red time calculation
- Days: Set days for yellow and red time calculation
- Yellow time: Data will be displayed with a “Yellow” status when this period is reached.
- Red time: Data will be displayed with a “Red” status when this period is reached.
Step 3 – Devices
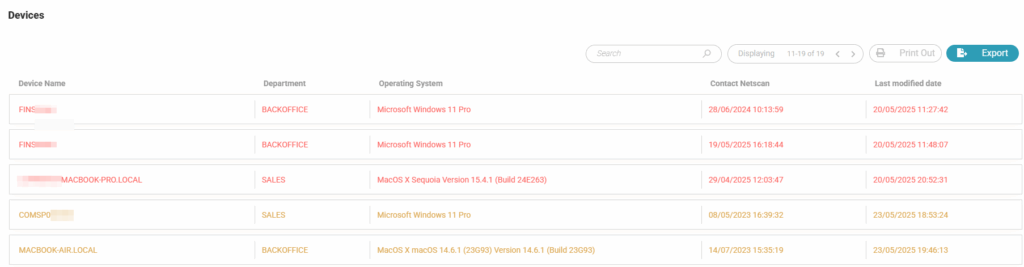
In the image above, the data in “Yellow” have been out of communication for 1 day, and the data in “Red” have been out of communication for 5 days or more.
Step 4 – Export data
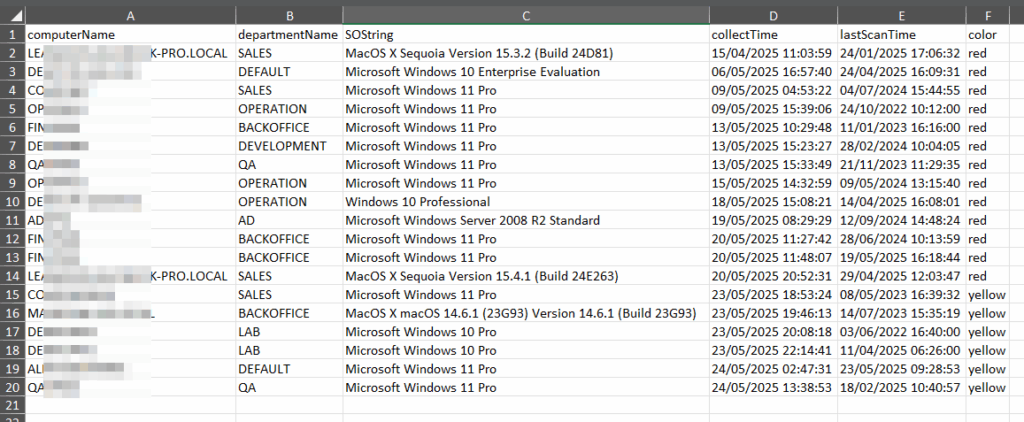
The button “Export” generate a “.csv” file to download
Step 5 – Print out (PDF)
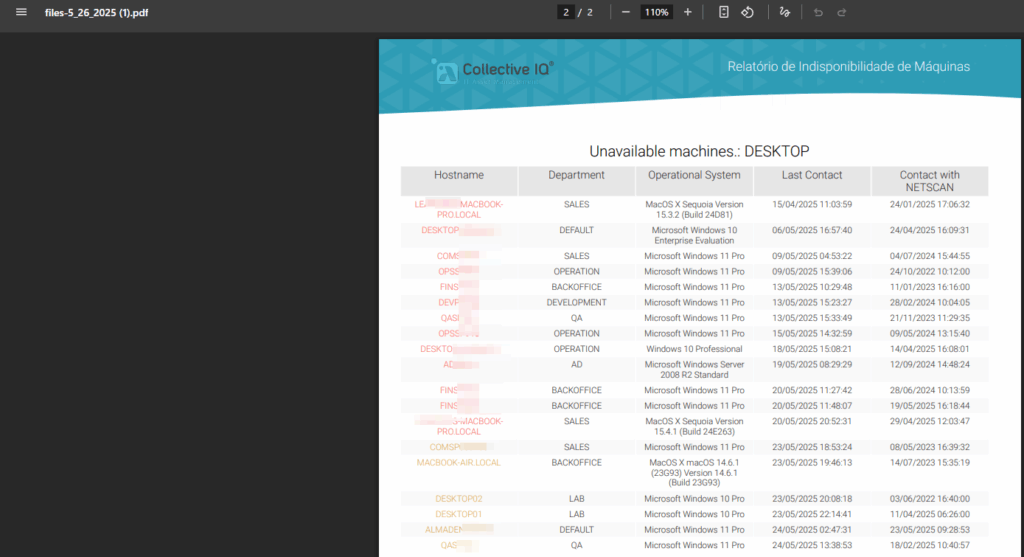
The “Export” button generates a “.pdf” file for download.
