
Collective IQ® ITAM
Dashboard
Dashboard
Your Control Center
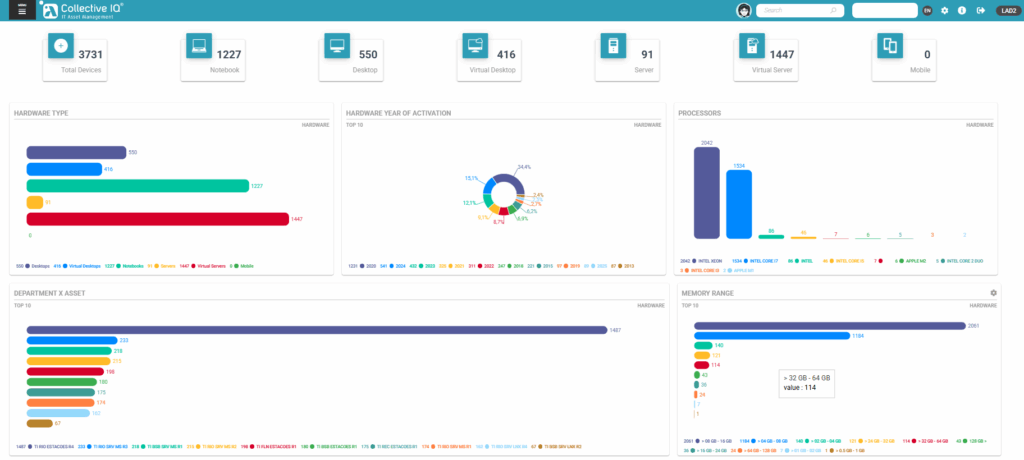
Imagine an airplane’s cockpit: it shows everything that’s working and everything that needs attention. That’s what the CIQ ITAM Dashboard offers — a clear view of your environment, with alerts, summaries, and key indicators.
This is where you start your day and set your priorities.
- Total Devices: Assets, including notebooks, desktops, servers and virtual machinines.
- Hardware Type: Breakdown of assets by type — desktops, notebooks, servers, virtual servers, and virtual desktops.
- Hardware Activation Year: Insights into the hardware distribution by year of activation, highlighting the top 10 years.
- Processors: Overview of processor types.
- Assets by Department: Top 10 departments ranked by the number of devices assigned.
- Memory Range: Distribution of devices according to their memory capacity, showing the most common ranges.
- Operating Systems: Analysis of the operating systems in use.
- Hardware Manufacturers: Top 10 hardware brands.
- Agent Status: Information on enrollment, backlog, and inactive statuses for desktops, notebooks, servers, and SNMP devices.
- Software by Manufacturer: Top 10 software vendors.
- Number of Monitors per Asset: Statistics on how many monitors are connected to each device.
This dashboard provides a clear and organized view of your IT landscape, supporting decision-making and strategic planning.
