Experience Score
Experience Score Calculation for Devices
Overview
CIQ DEX (Digital Employee Experience) measures the quality of the end-user experience based on objective metrics collected from devices.
Each metric is scored from 1 to 10, and the relative weight of each metric is defined in:
Administrative Settings > Customization.
The rating can be measured as:
Good Experience (7 to 10) – Users perceive responsiveness and reliability.
Average Experience (4 to 6) – Acceptable experience, but with areas of concern.
Frustrating Experience (1 to 3) – Poor experience, impacting productivity.
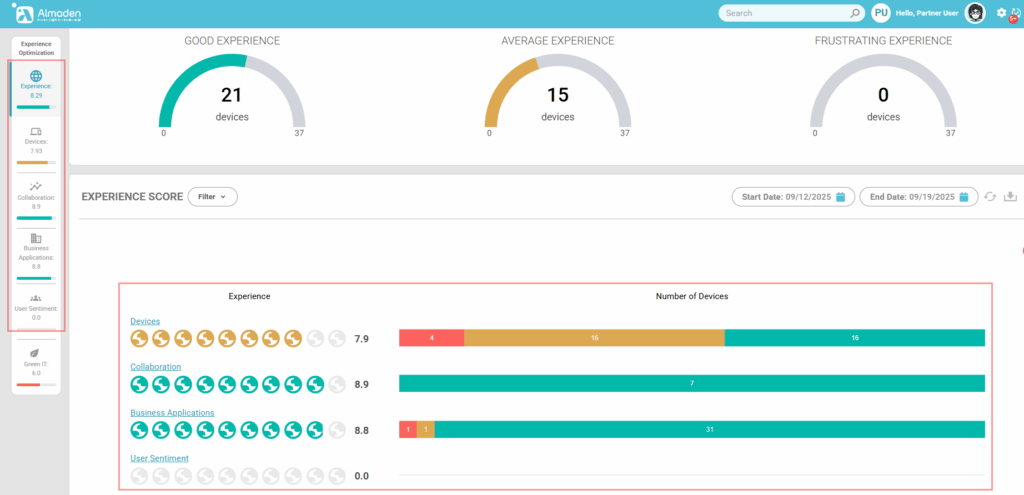
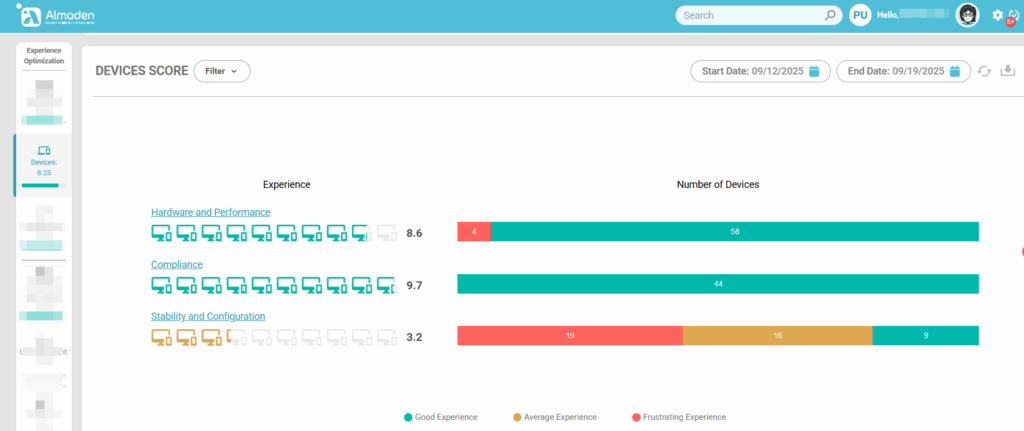
Device Calculation Structure
The calculation for Devices is divided into three main groups:
- Hardware and Performance
- Evaluates how well the device’s physical resources (CPU, memory, disk, startup time, and device age) support user productivity.
- Compliance
- Ensures the device follows organizational standards, including valid licensing, updated operating systems, and the presence of only approved software.
- Stability and Configuration
- Measures the reliability of the system by analyzing event errors and WMI health, indicating whether the device is stable and properly configured.
Together, these groups provide a balanced view of both the technical health and policy compliance of each device, resulting in an accurate experience score.
Each group has specific metrics that contribute to the device’s score.
1. Hardware and Performance
This group measures the physical capacity and operational performance of the device. It considers key metrics such as CPU, physical and virtual memory, disk usage, device age, and Windows startup time. These indicators show how efficiently the hardware supports day-to-day tasks and how performance issues may impact the user experience.
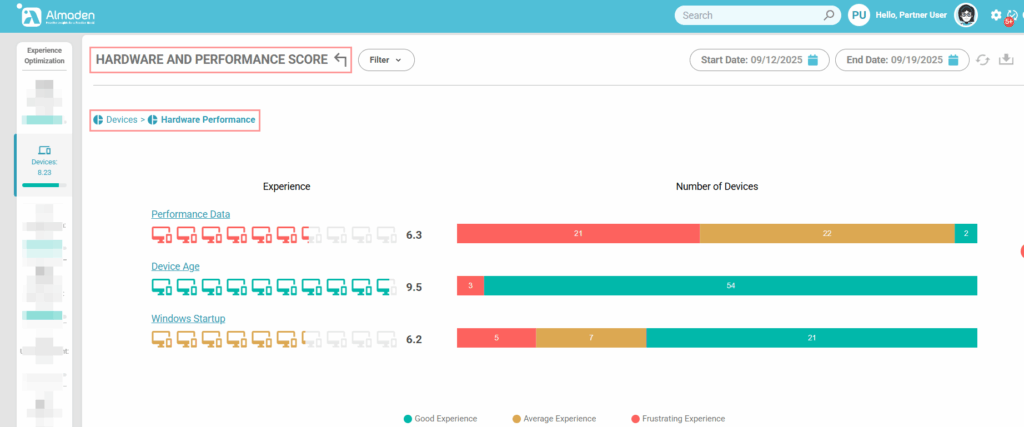
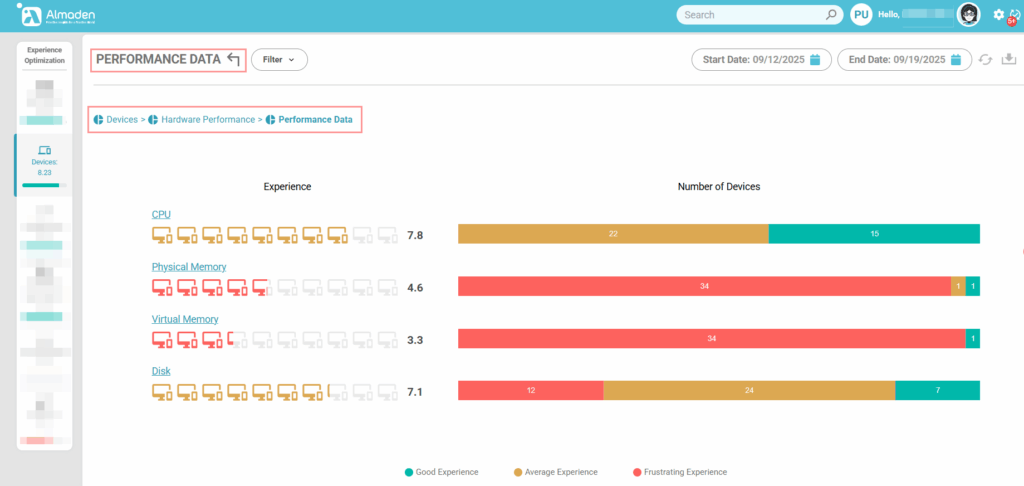
1.1 Performance Data
The score is based on the weighted average of the following indicators:
- CPU Usage (%)
- Example: A device with average CPU usage > 85% during work hours typically receives a score of ≤ 4.
- Physical Memory (RAM)
- Example: A laptop with only 4 GB RAM running multiple applications will score low.
- Virtual Memory (Swap/Pagefile)
- Example: Excessive paging activity lowers the score.
- Disk Performance (IOPS/Latency)
- Example: An HDD with high latency will score lower than an NVMe SSD.
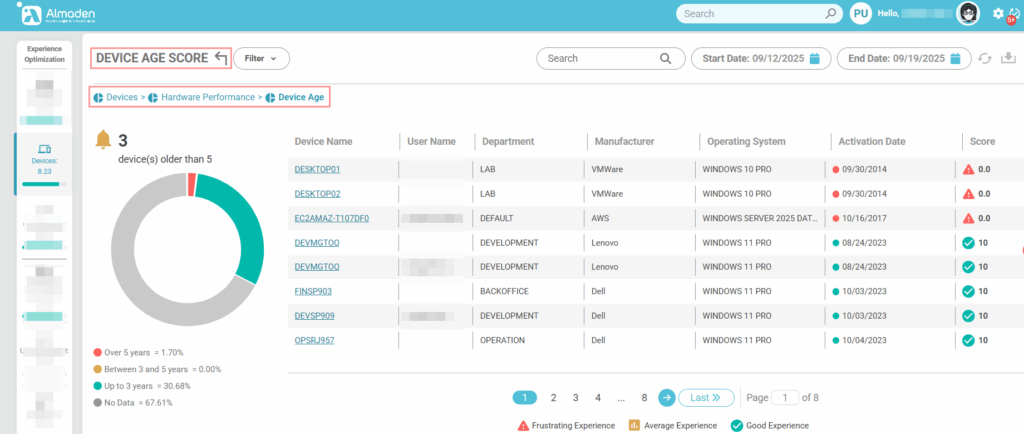
1.2 Device Age
Measures the age of the equipment, considering the time since its purchase or initial deployment. Older devices typically face greater risks of reduced performance, hardware failures, and compatibility issues. As the device ages, the score decreases, reflecting its diminishing capacity to deliver a smooth and reliable user experience.
This information is based on the BIOS Activation date reported by the device’s motherboard:
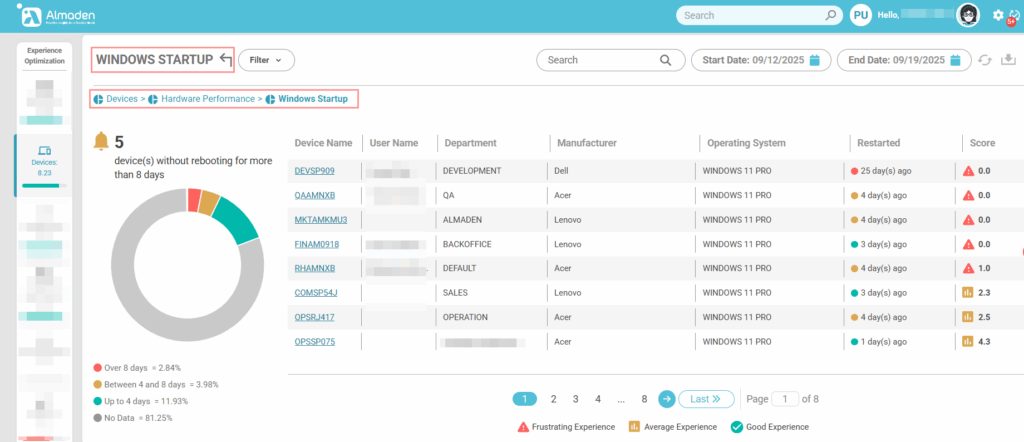
1.3 Windows Startup
Measures the time required for Windows to complete the boot process and become fully operational. Longer startup times often indicate underlying issues such as excessive startup applications, hardware limitations, or configuration problems. A higher score reflects faster boot performance, contributing to a more efficient and responsive user experience.
Boot time:
- < 30 seconds: score 10
- 30–60 seconds: score between 6 and 8
- 60 seconds: score ≤ 5
2. Compliance
Evaluates whether the device is aligned with organizational compliance policies. This group verifies critical aspects such as Windows licensing status, the application of security and feature updates, and the presence of only approved software. A higher score indicates that the device meets corporate standards, reducing risks related to security, legal exposure, and operational inconsistency:
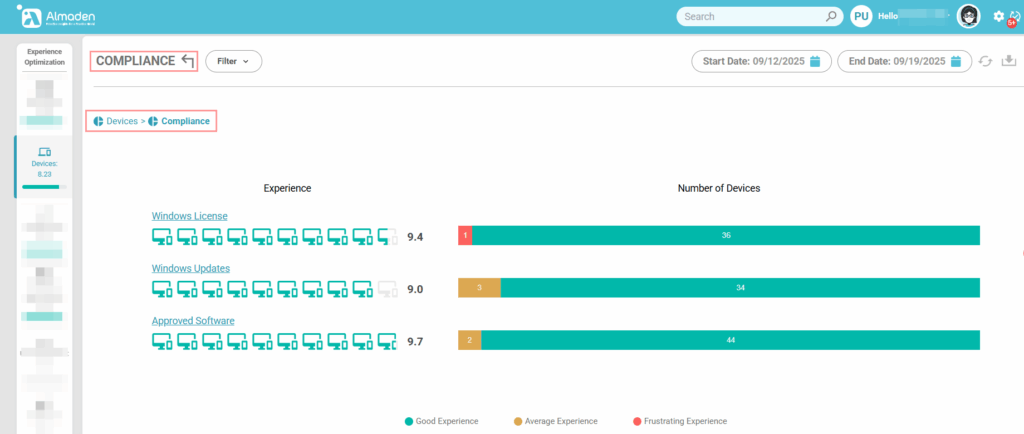
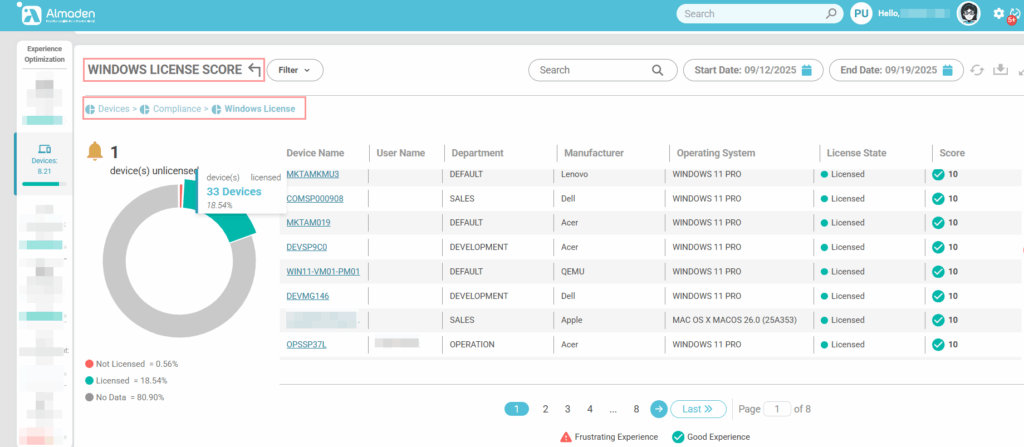
2.1 Windows License
Validates whether the device is properly licensed. A valid and active Windows license ensures compliance with legal and organizational requirements, resulting in the maximum score (10). If the license is invalid or expired, the device receives the minimum score (1), reflecting a critical compliance issue that must be addressed immediately:
- Properly licensed: score 10
- Invalid or expired license: score 0
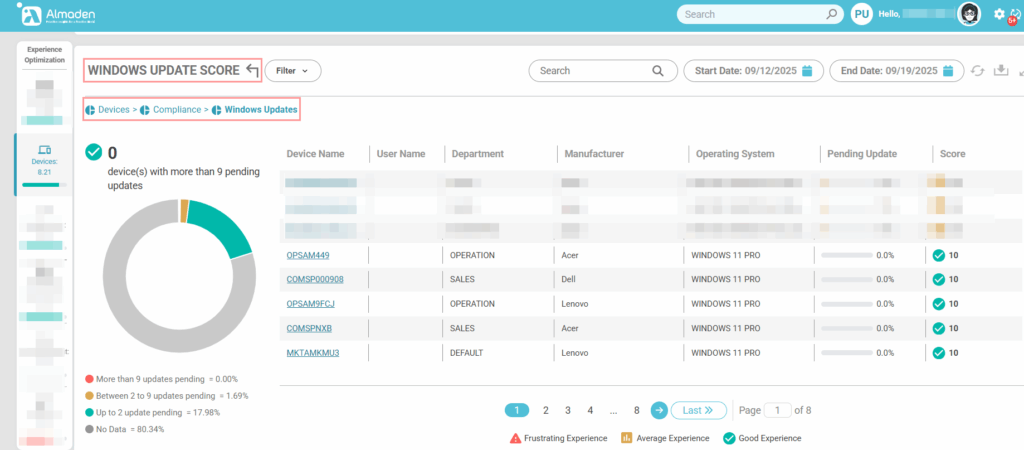
2.2 Operating System Update Score
Assesses whether the device has the latest Windows updates installed. A fully updated system, with all security patches and feature updates applied, receives the maximum score (10). Devices with critical pending updates receive a reduced score (≤ 4), highlighting potential security vulnerabilities and compliance risks that must be remediated promptly.
- Fully updated (latest patches installed): score 10
- Critical pending updates: score ≤ 4
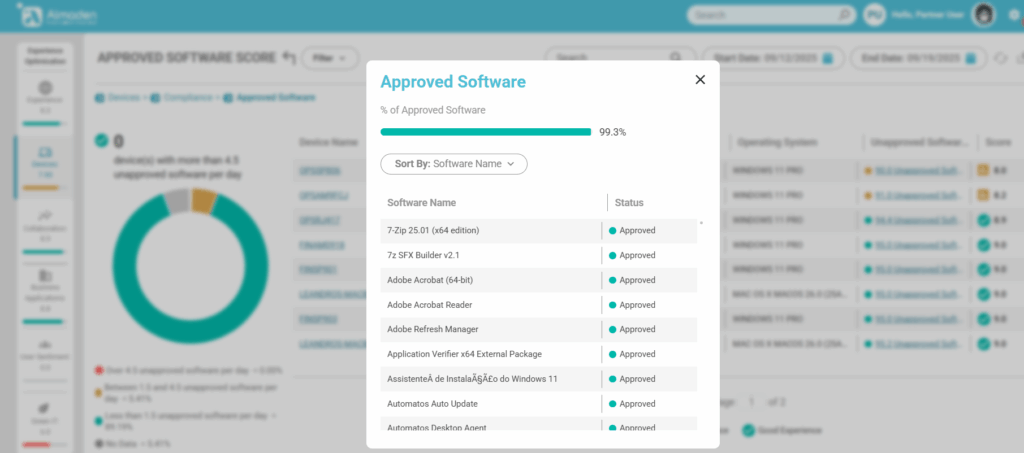
2.3 Approved Software
Evaluates whether only organization-approved software is installed on the device. Devices with exclusively approved applications receive the maximum score (10), ensuring compliance and minimizing security risks. If unapproved software is detected, a penalty of up to –5 points is applied within this group, reflecting potential operational, security, or policy compliance concerns.
- Only approved software installed: score 10
- Unapproved software detected: penalty of up to –5 points in this group.
- Note: Software approval is done at CIQ ITAM.
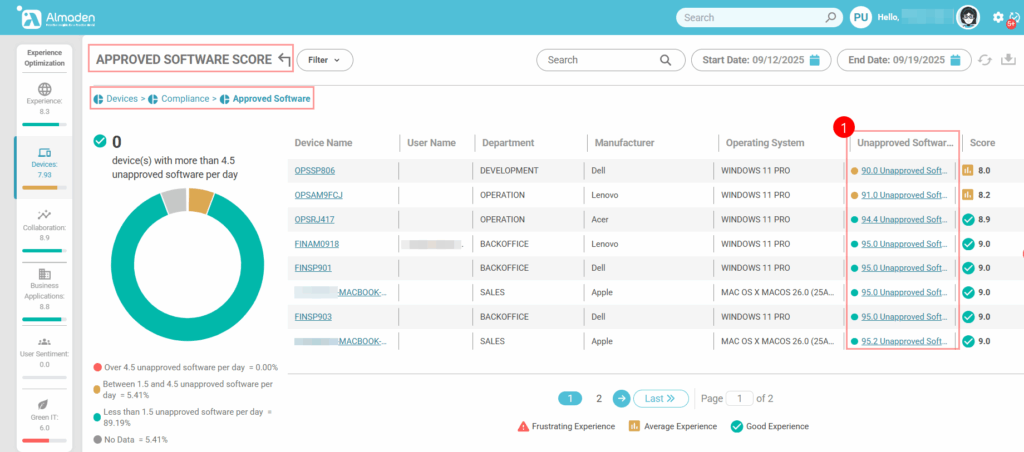
- Identify unapproved or undefined software by clicking on the “Unapproved Software” column
3. Stability and Configuration
Measures the operating system’s stability and the correctness of its internal configuration. This group evaluates factors such as system errors and WMI health to determine how reliably the device operates. A higher score reflects a stable and well-configured system, reducing unexpected crashes, failures, or disruptions that could negatively impact the user experience:
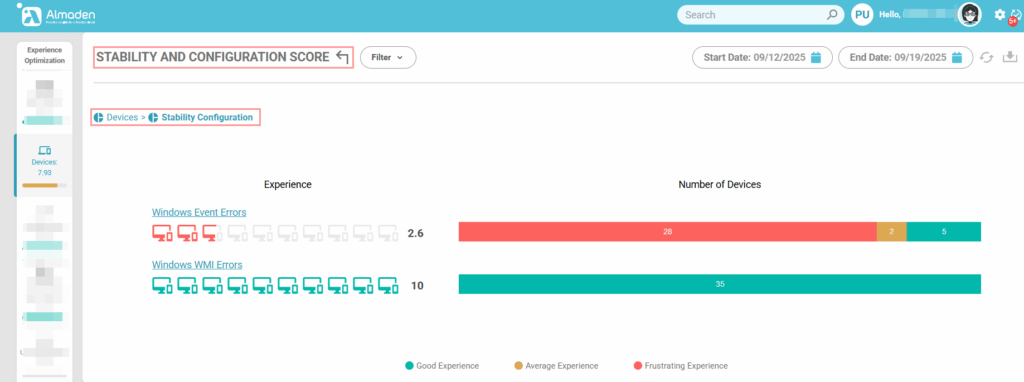
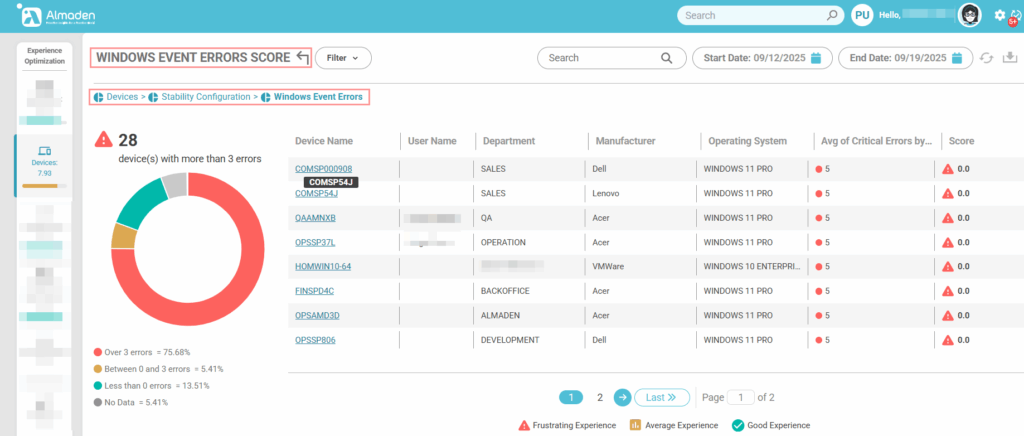
3.1 Windows Event Errors
Evaluates the number and severity of critical errors logged in the Windows Event Viewer. Devices with few or no critical errors receive the maximum score (10), indicating a stable and reliable system. Devices experiencing multiple recurring errors, such as kernel faults, driver failures, or BSODs (Blue Screen of Death), receive a reduced score (≤ 5), reflecting potential instability that can impact user productivity.
- Few or no critical errors logged: score 10
- Multiple recurring errors (Kernel, Drivers, BSOD): score ≤ 5
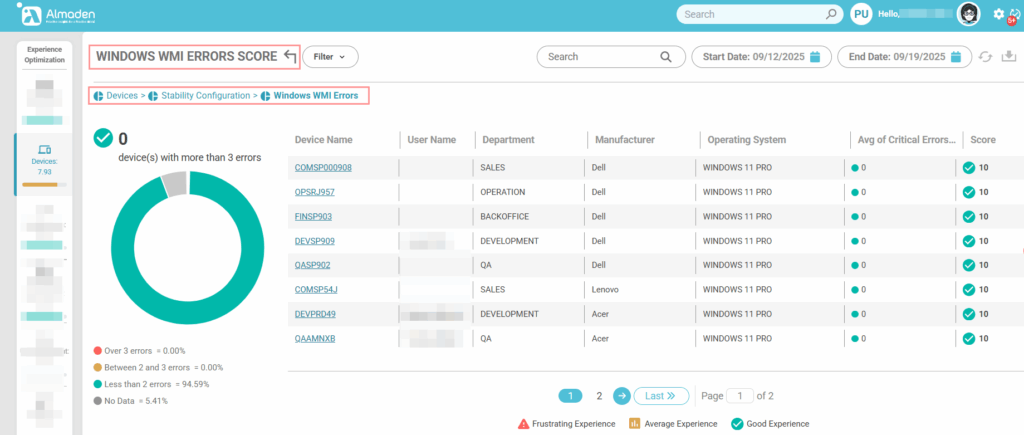
3.2 Windows WMI Errors
Assesses the health and reliability of the Windows Management Instrumentation (WMI) system. A fully healthy WMI, with no errors in namespaces or queries, receives the maximum score (10), indicating that system monitoring and management functions are operating correctly. Devices with recurring namespace or query failures receive a reduced score (≤ 4), reflecting potential issues that can affect system stability and the accuracy of collected performance data.
- Healthy WMI: score 10
- Recurring namespace or query failures: score ≤ 4
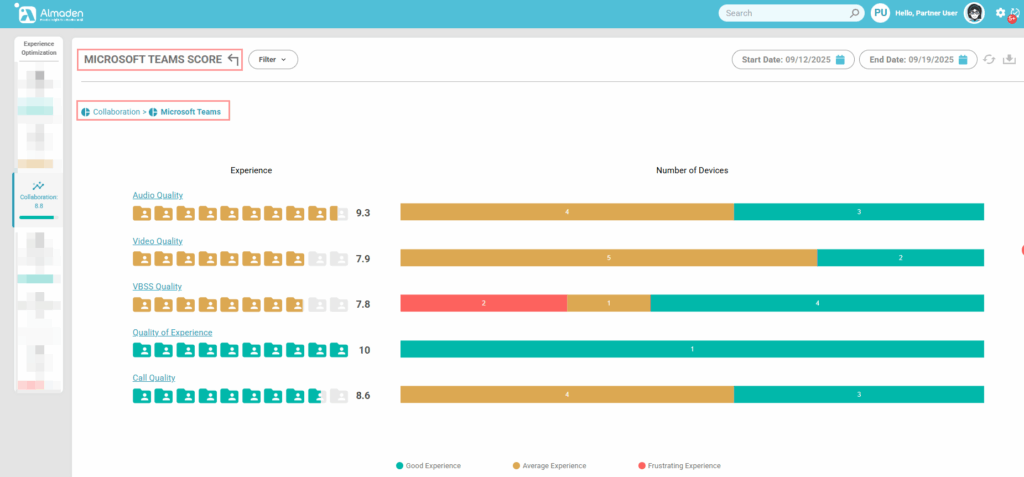
Collaboration Calculation Structure
This category evaluates the quality of communication and collaboration specifically through Microsoft Teams. These metrics are collected only when Teams integration is enabled in CIQ DEX.
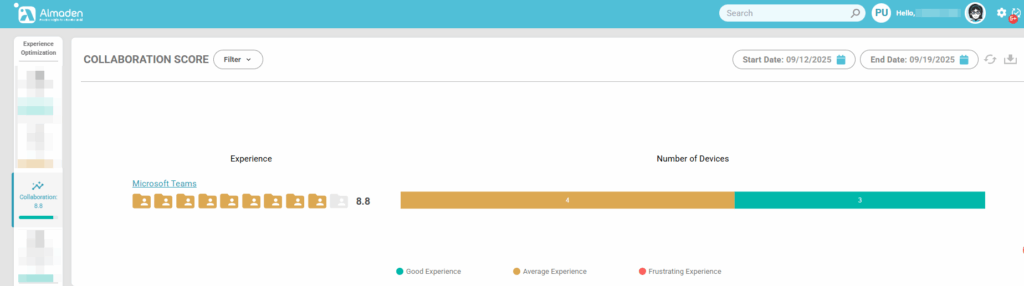
4.1 – Microsoft Teams
Key metrics include:
- Audio Quality – Measures clarity, latency, jitter, and packet loss during voice calls to ensure smooth communication.
- Video Quality – Assesses resolution, frame rate, and stability of video calls.
- VBSS Quality (Video-Based Screen Sharing) – Evaluates performance of screen sharing sessions, including responsiveness and visual clarity.
- Quality of Experience (QoE) – Overall perception of collaboration session quality from the user’s perspective.
- Call Quality – Aggregated score combining audio, video, and network performance to determine the effectiveness of meetings.
A high score indicates that employees can communicate and collaborate efficiently without technical interruptions, improving productivity and engagement in remote or hybrid environments.
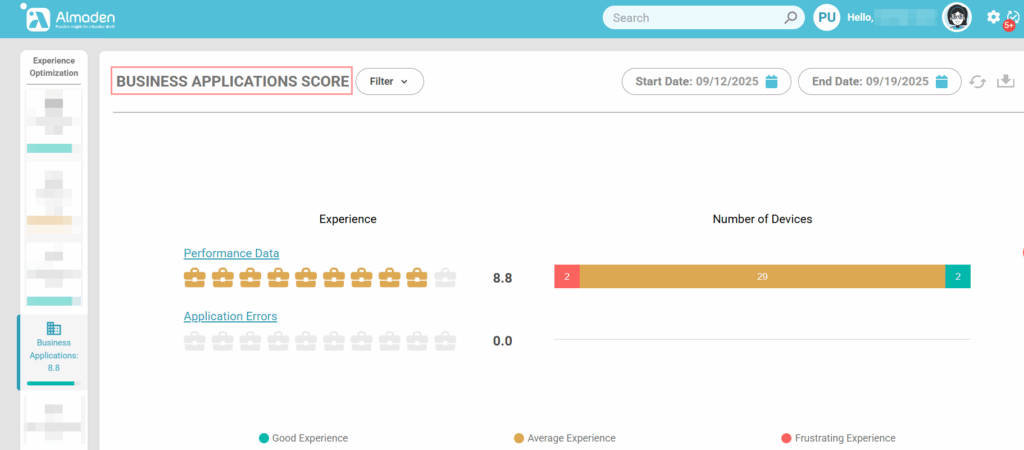
Business Applications Calculation Structure
This category evaluates the performance and reliability of business-critical applications configured in CIQ DEX. It helps ensure that employees can complete their work efficiently without disruption from application issues.
Key metrics include:
- Performance Data – Measures CPU and RAM usage of configured business applications. High resource consumption can indicate inefficiencies or potential bottlenecks that may impact user productivity.
- Application Errors – Tracks errors, crashes, and failures within business applications. Frequent errors reduce the score, highlighting applications that may require troubleshooting or optimization.
A high score reflects that business applications are running efficiently and reliably, supporting productivity and minimizing technical frustrations for end users.
5.1 Performance Data – Business Applications
The Performance Data metric for business applications evaluates how efficiently an application uses system resources, focusing on CPU and physical memory (RAM).
- CPU Usage – When the application consumes a high percentage of CPU, it can slow down the system, causing delays and interruptions in other tasks.
- RAM Usage – Excessive memory usage indicates the application is using too much of the system’s available RAM, which can lead to sluggish performance, crashes, or unresponsiveness.
In this metric, higher resource consumption directly reduces the experience score:
- Low consumption → Good Experience
- Moderate consumption → Average Experience
- High consumption → Frustrating Experience
This approach ensures that applications that heavily tax system resources are identified as frustrating for users, highlighting areas that may require optimization or upgrades.
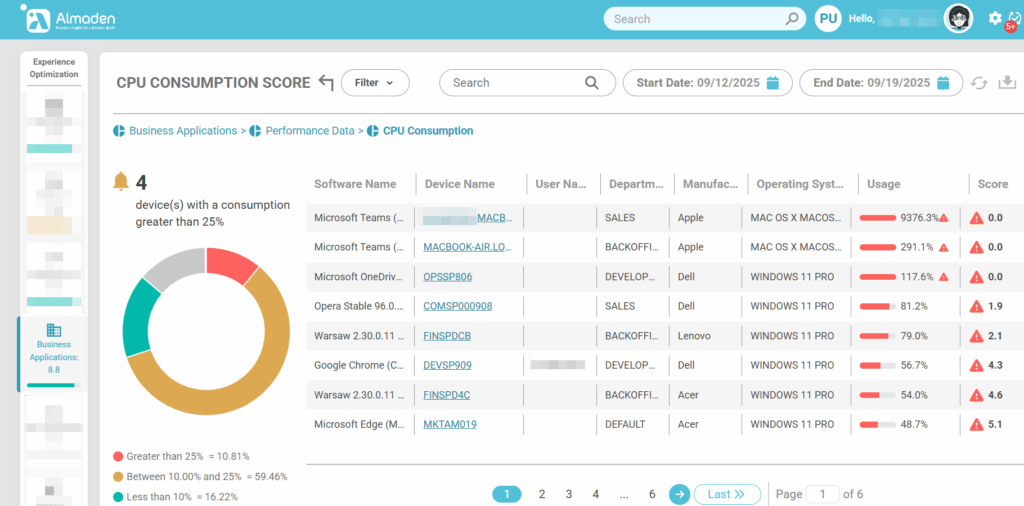
It is important to check the “Software Name” column to identify the software in metrics
User Sentiment Calculation Structure
The User Sentiment Score measures the perceived experience of employees with the technology they use daily. Unlike purely technical metrics, this score captures the human perspective, providing insight into satisfaction, usability, and productivity from the end-user point of view.
The score is built from surveys that collect responses across three key areas:
- Device Sentiment – Evaluates how users feel about their devices, including performance, reliability, and ease of use.
- Collaboration Sentiment – Assesses the user experience with communication and teamwork tools, such as video calls, chat, and screen sharing.
- Business Applications Sentiment – Captures feedback on the usability, performance, and reliability of critical business applications used for day-to-day work.
By combining these three dimensions, the User Sentiment Score complements technical metrics, giving IT teams a holistic view of the digital experience. It highlights areas where users are frustrated, satisfied, or neutral, enabling proactive interventions to improve productivity and overall employee satisfaction.
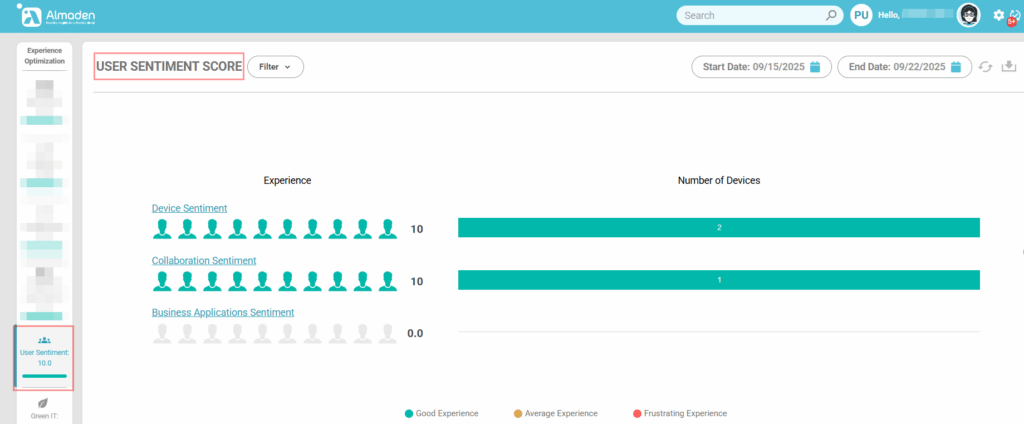
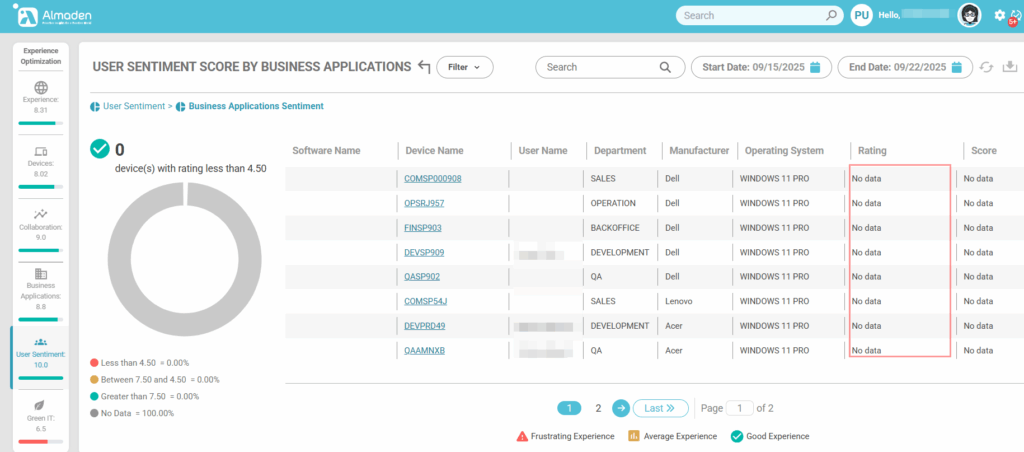
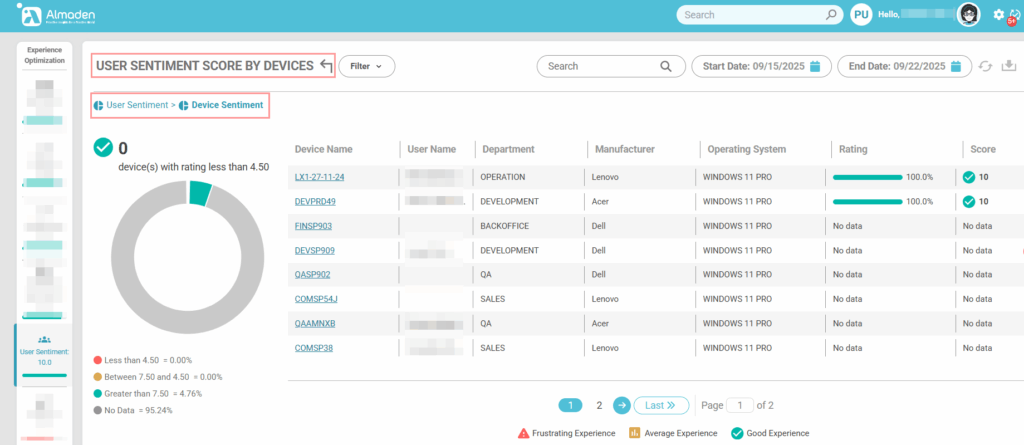
6.1 Device Sentiment
The User Sentiment Score provides a deep understanding of how employees perceive their technology environment, complementing technical performance metrics with human insights. It is composed of three main dimensions: Device Sentiment, Collaboration Sentiment, and Business Applications Sentiment.
In the image below, there were no user sentiment responses below 4.5, resulting in a high device score related to user sentiment.
Note: The weight of each score can be configured under Administrative Settings > Customization.
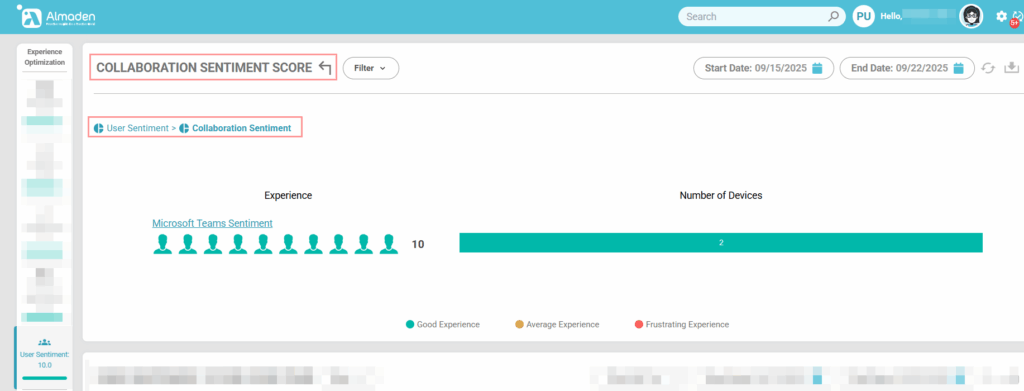
6.2 Collaboration Sentiment
Collaboration Sentiment captures the user experience with communication and teamwork tools, including video conferencing, chat platforms, and screen sharing. Feedback is gathered on aspects such as audio/video quality, ease of communication, and effectiveness of collaborative workflows. A high score shows that employees can communicate smoothly without disruptions, whereas a low score indicates that technical issues, latency, or poor integration may be hindering collaboration. This insight allows IT and management to optimize collaboration tools and improve remote or hybrid work efficiency.
6.3 Business Applications Sentiment
This dimension measures user satisfaction with critical business applications used daily, such as CRM, ERP, or finance software. Surveys focus on performance, stability, and usability, assessing whether the applications meet employees’ expectations and workflow requirements. Low scores may highlight performance bottlenecks, frequent crashes, or inefficient interfaces that reduce productivity. High scores reflect applications that support employees effectively, enabling them to complete tasks without friction.
Note: When no results are displayed or marked as “No Data,” it means that during the period selected by the filter, no user survey responses were submitted for the related topic.