
User Sentiment Calculation Structure
Introduction
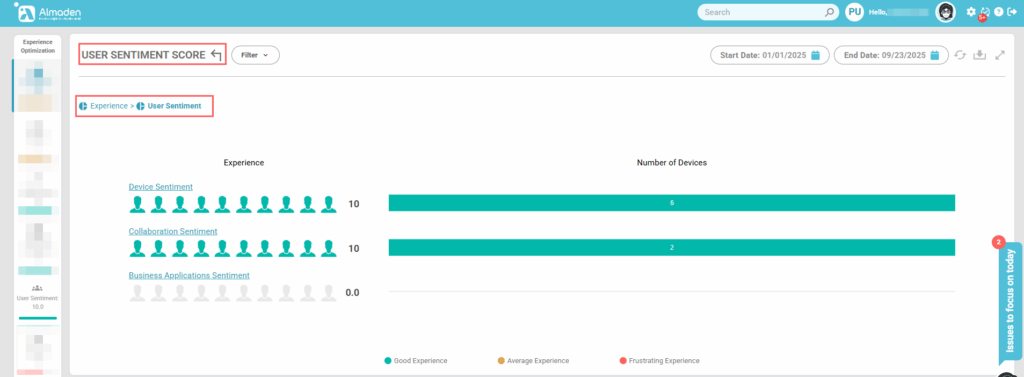
The User Sentiment Score provides a comprehensive view of how employees perceive their technology environment, complementing technical performance metrics with direct human feedback. All scores are built from surveys specifically designed, distributed, and answered by end users, ensuring that employee voices are fully represented in the evaluation.
It is composed of three main dimensions:
- Device Sentiment
- Collaboration Sentiment
- Business Applications Sentiment
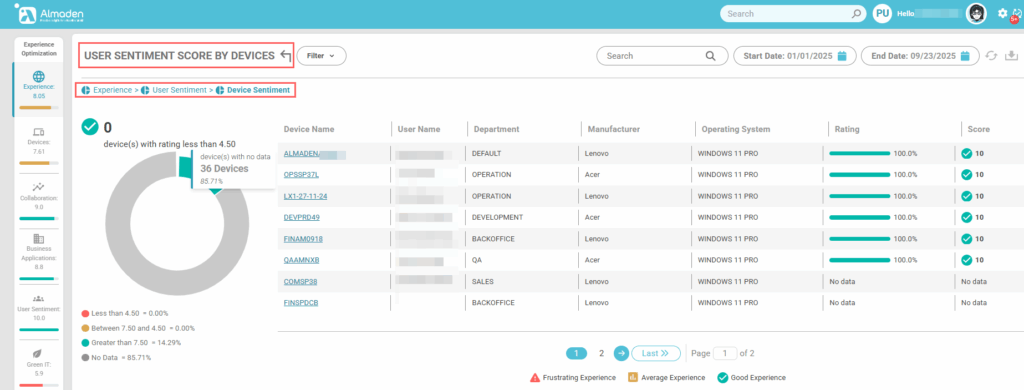
1. Device Sentiment
This dimension evaluates how users perceive the performance, reliability, and usability of their devices. Surveys capture feedback on responsiveness, boot times, and overall satisfaction with hardware and operating system performance.
- High scores suggest that employees feel their devices support their work effectively.
- Low scores reveal frustration points, often linked to slow performance, recurring errors, or outdated hardware.
These insights help IT teams prioritize upgrades, maintenance, or proactive interventions to improve productivity and user satisfaction.
- (Red) Less than 4.50;
- (Yellow) Between 4.50 and 7.50;
- (Blue) Greater than 7.50;
- (Gray) No data.
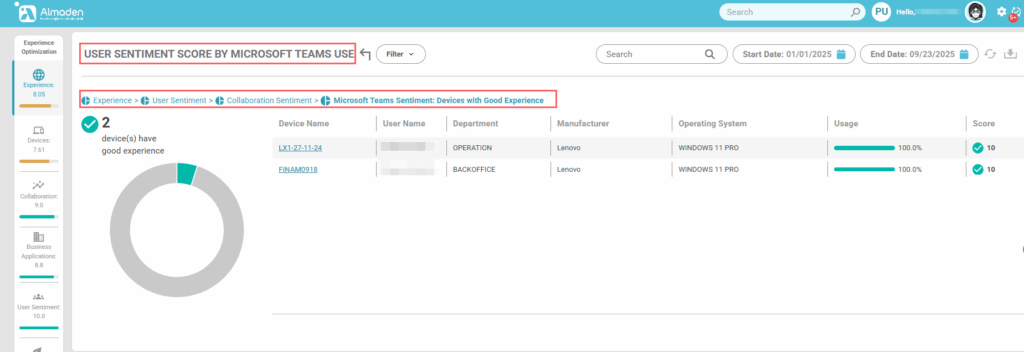
2. Collaboration Sentiment
Collaboration Sentiment reflects the user experience with communication and teamwork tools, such as video conferencing, chat platforms, and screen sharing. Surveys collect feedback on audio/video quality, ease of communication, and the overall effectiveness of collaborative workflows.
- High scores demonstrate that employees can collaborate seamlessly without disruptions.
- Low scores highlight technical barriers, latency, or integration issues that may undermine communication and teamwork.
This knowledge enables IT and business leaders to optimize collaboration platforms, directly enhancing hybrid and remote work effectiveness.
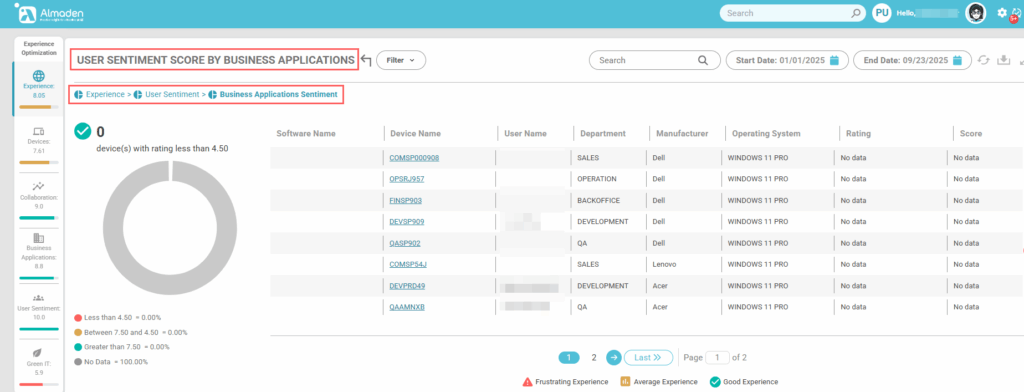
3. Business Applications Sentiment
This dimension measures user satisfaction with essential business applications (e.g., CRM, ERP, finance, or HR systems). Surveys gather insights into application performance, stability, and usability, capturing how well these tools support day-to-day workflows.
- High scores reflect smooth, reliable experiences where applications empower employees to work without friction.
- Low scores may reveal bottlenecks such as crashes, performance degradation, or unintuitive interfaces.
Such feedback highlights opportunities for optimization, patching, or even system replacement, ensuring business applications truly align with user needs.
Holistic View of Experience
By combining these three dimensions—all powered by direct survey responses—the User Sentiment Score delivers a holistic view of the employee experience. It not only highlights strengths but also pinpoints areas requiring improvement.
This empowers organizations to:
- Proactively address frustration points.
- Optimize IT investments and support strategies.
- Strengthen employee engagement and productivity.
- Ensure technology consistently enhances overall satisfaction.
