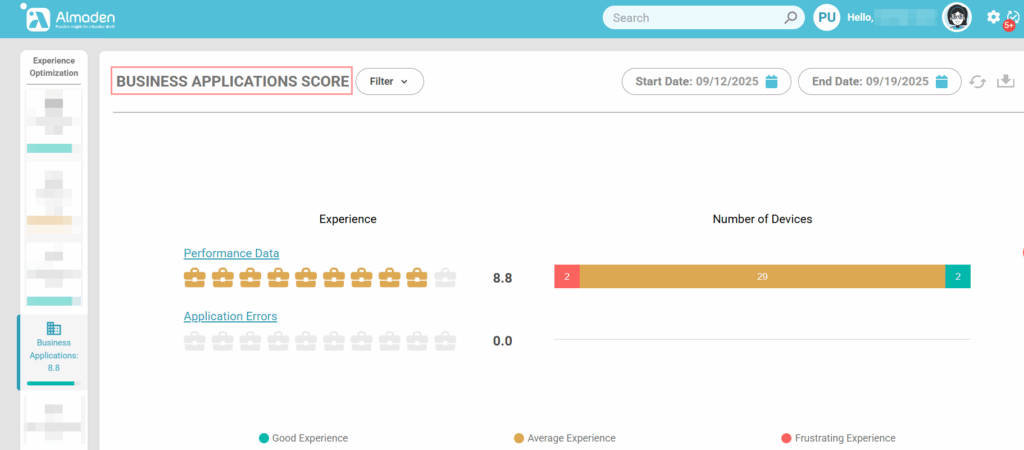
Business Applications Calculation Structure
This category evaluates the performance and reliability of business-critical applications configured in CIQ DEX. It helps ensure that employees can complete their work efficiently without disruption from application issues.
Key metrics include:
- Performance Data – Measures CPU and RAM usage of configured business applications. High resource consumption can indicate inefficiencies or potential bottlenecks that may impact user productivity.
- Application Errors – Tracks errors, crashes, and failures within business applications. Frequent errors reduce the score, highlighting applications that may require troubleshooting or optimization.
A high score reflects that business applications are running efficiently and reliably, supporting productivity and minimizing technical frustrations for end users.
1. Performance Data – Business Applications
The Performance Data metric for business applications evaluates how efficiently an application uses system resources, focusing on CPU and physical memory (RAM).
- CPU Usage – When the application consumes a high percentage of CPU, it can slow down the system, causing delays and interruptions in other tasks.
- RAM Usage – Excessive memory usage indicates the application is using too much of the system’s available RAM, which can lead to sluggish performance, crashes, or unresponsiveness.
In this metric, higher resource consumption directly reduces the experience score:
- Low consumption → Good Experience
- Moderate consumption → Average Experience
- High consumption → Frustrating Experience
This approach ensures that applications that heavily tax system resources are identified as frustrating for users, highlighting areas that may require optimization or upgrades.
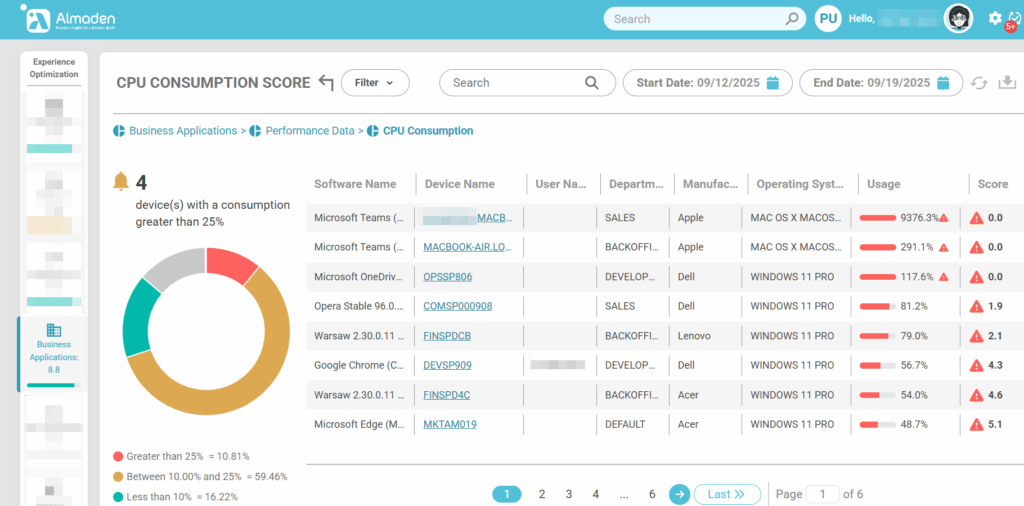
It is important to check the “Software Name” column to identify the software in metrics
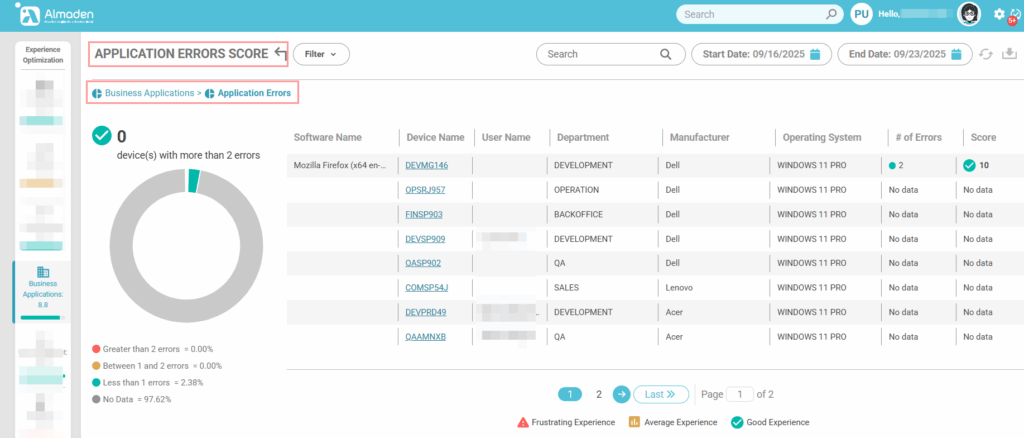
2. Performance Data – Application Errors
The Application Errors metric evaluates the stability of business applications by monitoring the frequency and severity of errors encountered during execution. These errors directly impact user productivity and satisfaction, as they disrupt workflows and may cause data loss.
- Error Frequency – A high number of recurring errors indicates poor application reliability, often leading to repeated interruptions in daily activities.
In this metric, the presence of errors decreases the experience score:
- No or minimal errors → Good Experience
- Occasional minor errors → Average Experience
- Frequent or critical errors → Frustrating Experience
This evaluation highlights unstable or poorly optimized applications, helping organizations prioritize corrective actions, apply patches, or consider replacements to ensure consistent performance and improve the digital employee experience.
- (Red) More than 03 errors;
- (Yellow) Between 02 to 03 errors;
- (Blue) Less than 02 errors;
- (Gray) No data.