
Green IT Calculation Structure
Introduction
Green IT refers to strategies and practices aimed at reducing the environmental impact of information technology operations while optimizing energy efficiency and resource usage. With modern IT environments becoming more complex and distributed, understanding the energy consumption of devices, their operational uptime, and patterns of usage is essential for sustainable management.
The Collective IQ® DEX (CIQ DEX) platform provides detailed insights into Green IT metrics, allowing organizations to monitor, analyze, and optimize the energy footprint of their IT assets while maintaining operational performance and employee productivity.
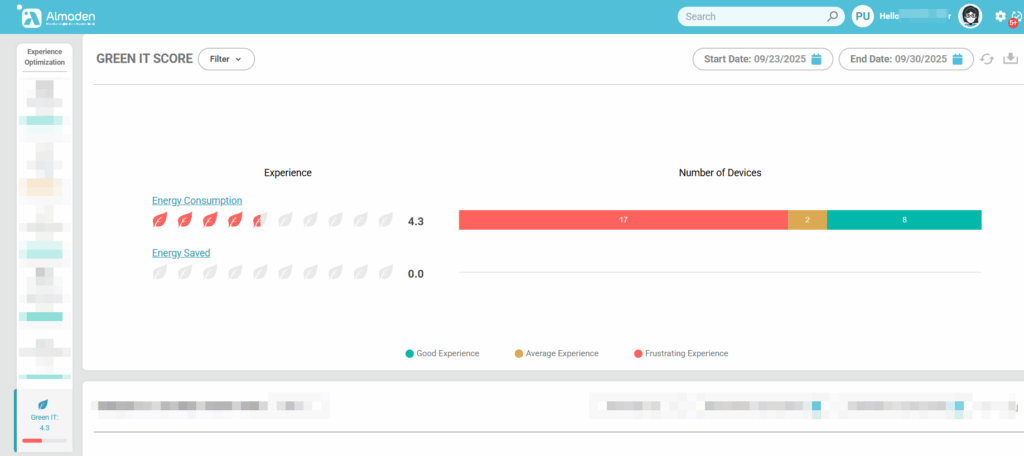
Energy Consumption
The Energy Consumption module in CIQ DEX measures the energy usage of devices across the organization, providing visibility into where resources are being consumed and highlighting opportunities for efficiency improvements.
1. Energy Consumption
- Tracks the actual energy used by devices over time.
- Helps IT teams identify high-consumption devices and take actions to reduce unnecessary energy usage.
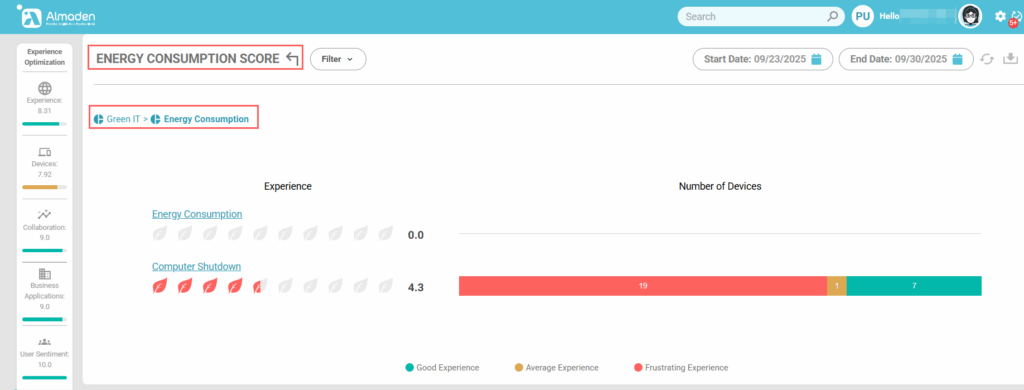
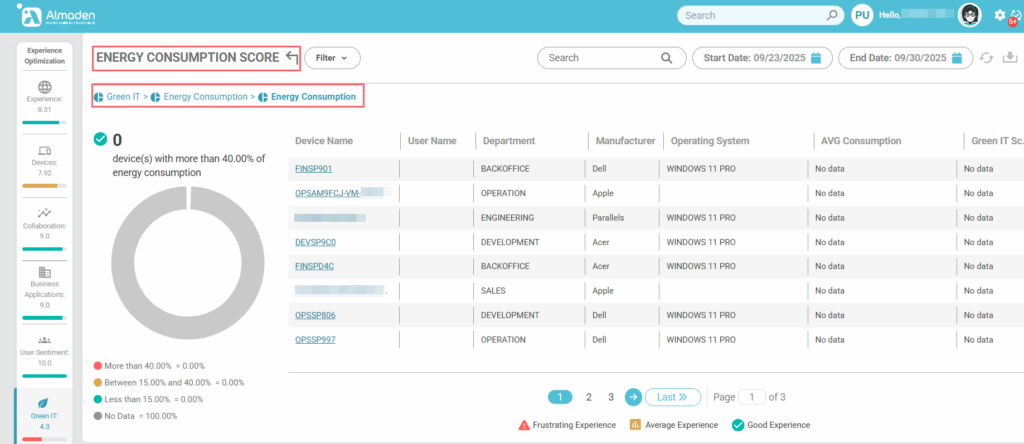
1.1 Energy Consumption
Measures the energy usage of devices across the organization. This metric identifies high-consumption devices and highlights opportunities to optimize energy efficiency, reducing operational costs and environmental impact.
1.2 Computer Shutdown
Tracks device uptime and assigns a Green IT score based on usage:
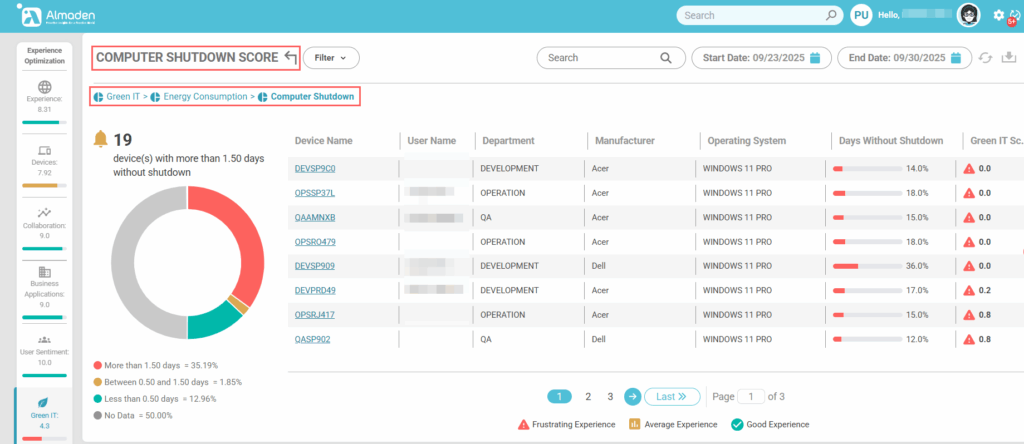
- More than 1.50 days: 35.19%
- Between 0.50 and 1.50 days: 1.85%
- Less than 0.50 days: 12.96%
- No Data: 50.00%
This metric highlights devices left running unnecessarily, enabling organizations to enforce shutdown policies and improve sustainability practices.
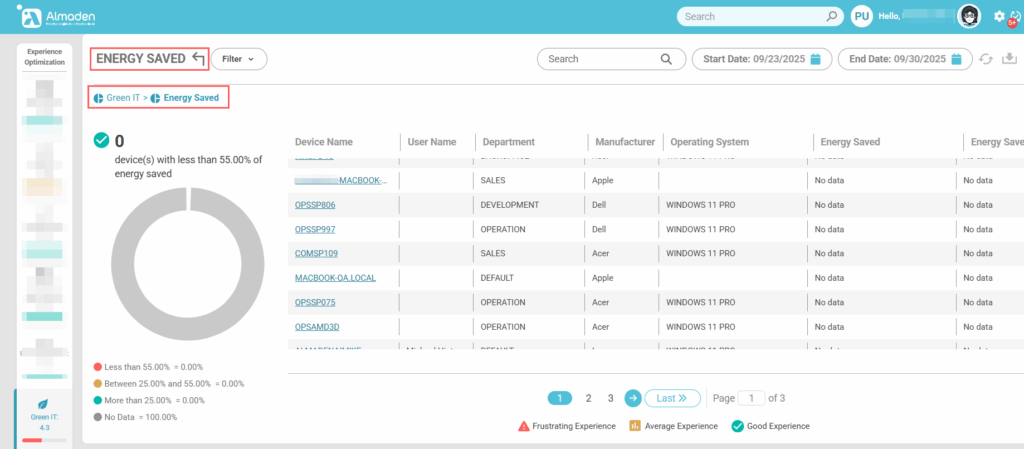
2. Energy Saved
Indicates the proportion of energy conserved by devices. Current metrics show:
- Less than 55.00% saved: 0.00%
- Between 25.00% and 55.00% saved: 0.00%
- More than 25.00% saved: 0.00%
- No Data available: 100.00%
This reflects that no devices currently report measurable energy savings, highlighting an opportunity to implement energy-saving practices or policies.
Green IT Visualization
CIQ DEX provides several ways to visualize Green IT performance and trends:
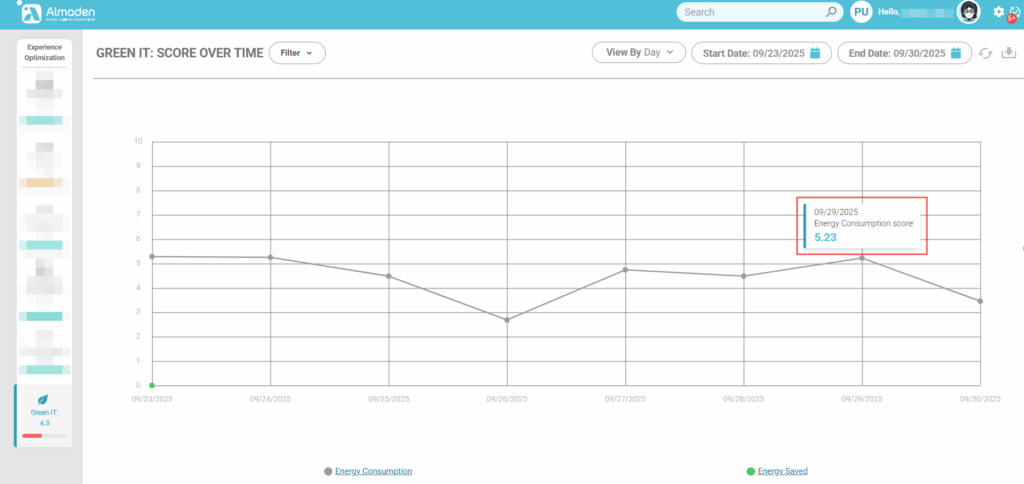
- Score Over Time
- Displays how the Green IT score evolves for individual devices or groups over a selected period.
- Enables IT managers to track improvements or identify areas needing attention.
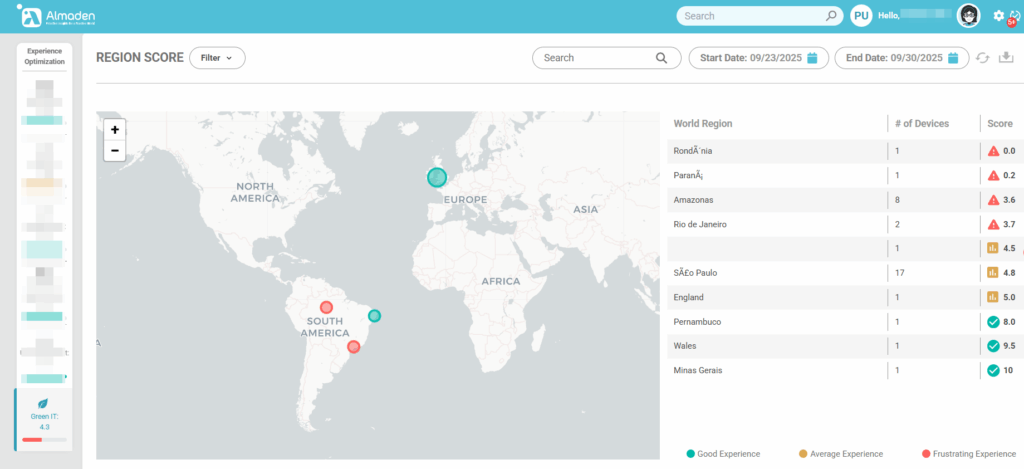
- Region Score
- Compares Green IT performance across different geographical locations or organizational units.
- Helps identify regions with higher energy consumption or poor shutdown practices.
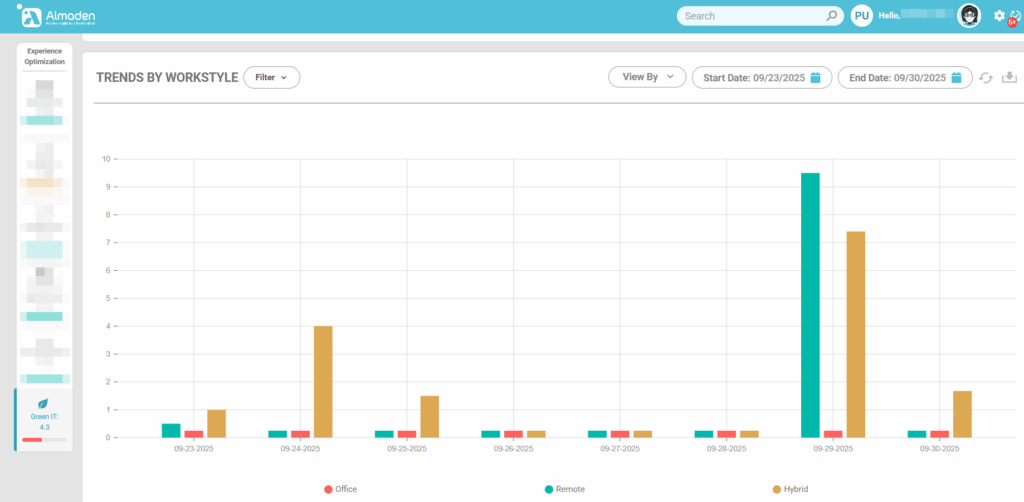
- Trends by Workstyle
- Analyzes energy usage and device uptime based on employee workstyles (e.g., office-based, remote, hybrid).
- Allows optimization of device policies according to usage patterns, reducing energy waste without impacting productivity.
Benefits of Green IT
- Reduced Energy Costs – Monitoring and enforcing efficient device usage lowers electricity consumption.
- Sustainability Compliance – Supports corporate sustainability initiatives and reporting.
- Operational Insights – Provides actionable data to optimize IT operations without disrupting employees.
- Employee Awareness – Encourages energy-conscious behavior among users through visibility of consumption patterns.
