
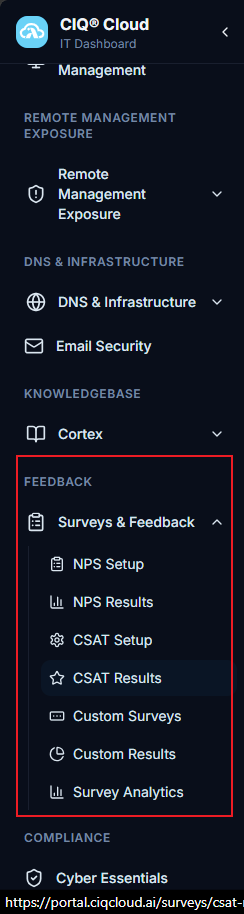
FEEDBACK
Surveys & Feedback
NPS Setup
Overview
The NPS Setup page is used to create and manage Net Promoter Score (NPS) survey campaigns. Administrators can configure survey questions, customize invitation emails, import and manage recipients, and distribute surveys to collect customer feedback. The module provides a centralized location for maintaining survey content, controlling distribution settings, and monitoring survey readiness before invitations are sent.
Navigation
Surveys & Feedback > NPS Setup
NPS Surveys
The NPS Surveys section displays all available survey campaigns and their current status. Administrators can review existing surveys, access configuration settings, preview campaign content, and create new surveys.

Survey Information
Survey Name
Displays the name assigned to the survey campaign.
Frequency
Displays how often the survey is scheduled to be distributed.
Next Due Date
Displays the next scheduled survey distribution date.
Status
Displays the current status of the survey campaign.
Preview
Allows administrators to preview the survey before distribution.
Delete
Removes the selected survey campaign.
New Survey
Creates a new survey campaign.
Questions
The Questions tab defines the content displayed to survey recipients. Administrators can configure survey languages, contact information, survey text, and the questions that will be included in the survey.
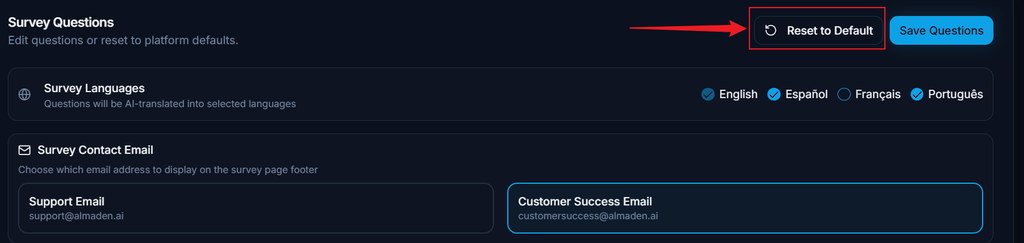
Survey Languages
Defines the languages available to survey participants.
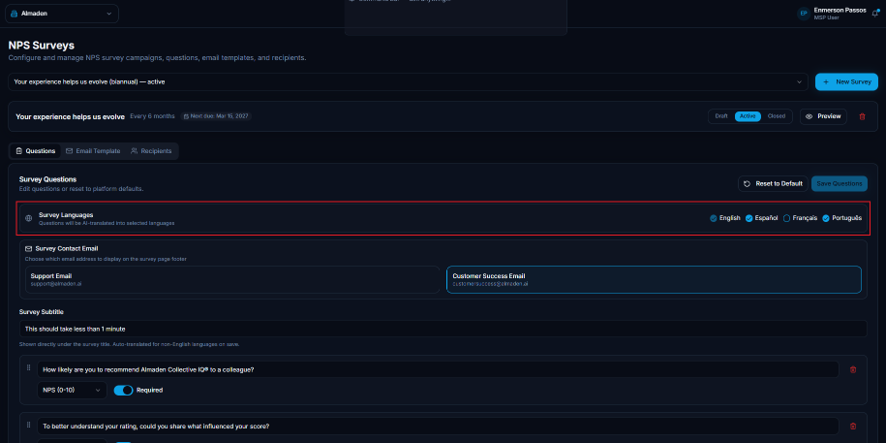
Observed Options
- English
- Español
- Français
- Português
Survey Contact Email
Defines the contact details displayed within the survey interface.

Support Email
Specifies the email address displayed to participants for support-related inquiries.
Customer Success Email
Specifies the email address displayed to participants for customer success inquiries.
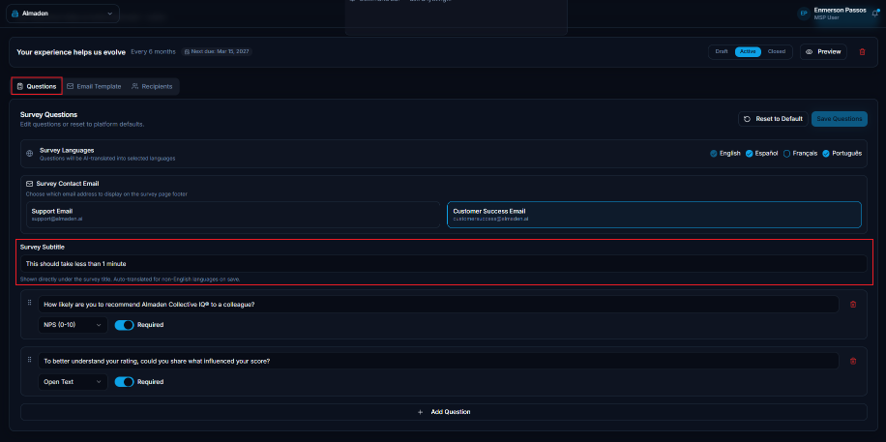
Survey Subtitle
Defines the text displayed directly below the survey title. This text is typically used to provide additional context, instructions, or introductory messaging to respondents.
Question
Defines the questions presented to survey participants.
Question Type
Determines the type of response expected from the participant.
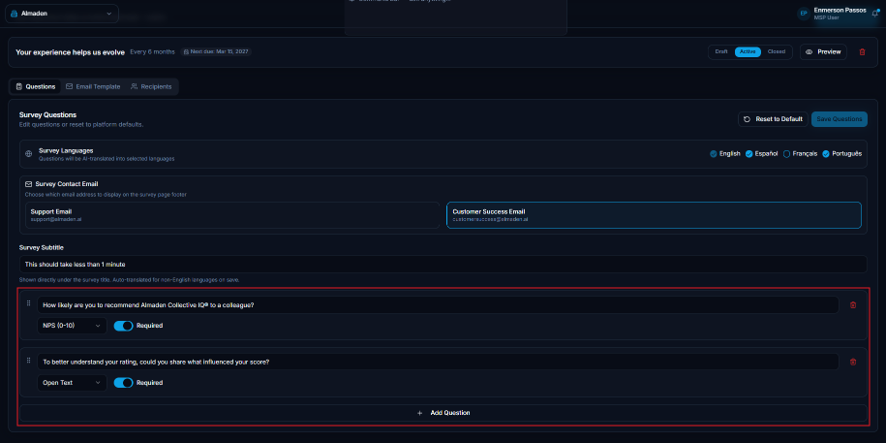
Observed Options
NPS (0-10)
Displays the standard Net Promoter Score rating scale ranging from 0 to 10, allowing respondents to indicate their likelihood of recommending the organization.
Open Text
Allows participants to provide written feedback using a free-text response field.
Required
Determines whether a response must be provided before the survey can be submitted.
Observed Options
- Enabled
- Disabled
When enabled, respondents must answer the question before proceeding.
Add Question
Adds a new question to the survey configuration.

Reset to Default
Restores the default survey question configuration.
Save Questions
Saves all changes made within the Questions tab.

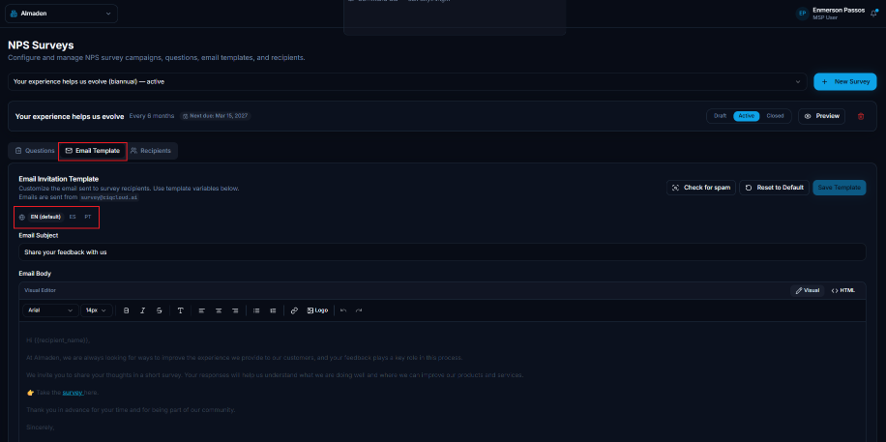
Email Template
The Email Template tab defines the invitation email that is sent to survey recipients. Administrators can customize email content, manage language-specific templates, and preview invitations prior to distribution.
Email Invitation Template
Defines the email content delivered to survey recipients.

Language Selection
Determines which language-specific email template is being edited.
Observed Options
- EN (Default)
- ES
- PT
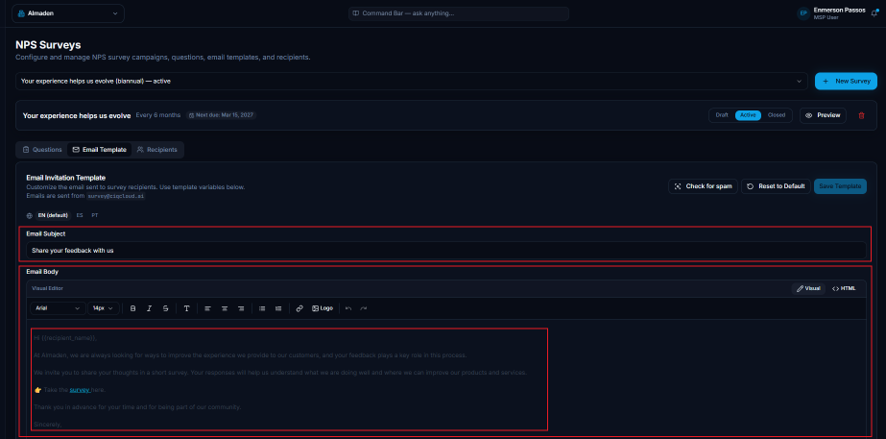
Email Subject
Defines the subject line displayed in the invitation email.
Email Body
Defines the email message displayed to recipients when they receive the survey invitation.
Editor Mode
Determines how email content is edited.
Observed Options
Visual
Provides a rich-text editing experience for formatting email content.
HTML
Allows the email template to be edited directly using HTML code.
Template Variables
Provides dynamic variables that can be inserted into the invitation email. These variables are automatically replaced with recipient-specific information when messages are generated.
System Footer
Displays the footer section automatically appended to survey invitation emails.

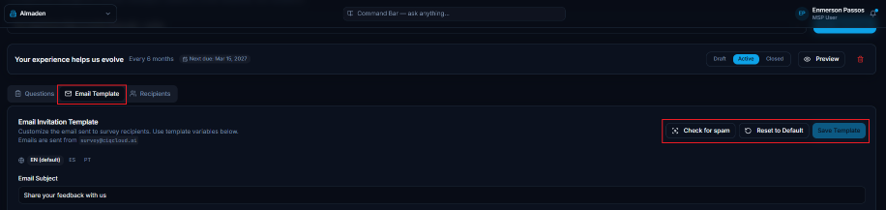
Template Actions
The following actions are available for managing email templates.
Check for Spam
Analyzes the email content and identifies potential spam-related issues that could affect email deliverability.
Reset to Default
Restores the default invitation email template.
Save Template
Saves all modifications made to the email template.
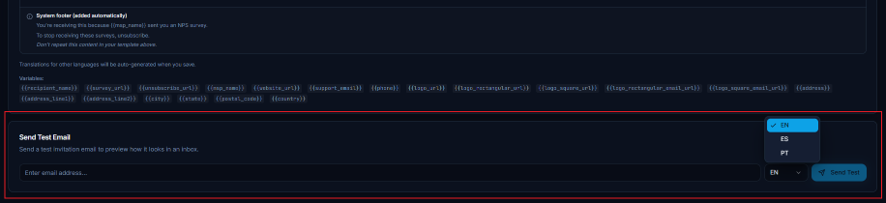
Send Test Email
Allows administrators to preview the survey invitation before sending it to recipients.
Email Address
Specifies the destination email address for the test message.
Language
Defines which language version of the template will be included in the test email.
Send Test
Sends the test email to the specified recipient.
Recipients
The Recipients tab manages survey recipients and controls the invitation distribution process.
Recipients are imported through a CSV file containing participant information. Once recipients have been uploaded, survey invitations can be sent directly from this section.
Survey Recipients
Allows administrators to import and manage survey participants.

Required CSV Columns
The uploaded CSV file must contain the following columns:
- name
- company
- job_title
- language
Supported Language Codes
The following language codes are supported when importing recipients:
- en
- es
- fr
- pt
Recipient Import Actions

Sample CSV
Downloads a CSV template containing the required file structure and supported field format.
Upload CSV
Uploads recipient information from a CSV file.
Send Invitations
Sends survey invitations to all imported recipients.
Recipient List
Displays all imported recipients currently associated with the survey campaign.
Each entry allows administrators to verify imported information before invitations are distributed.
Empty State Message
When no recipients have been uploaded, the following message is displayed:
No recipients uploaded yet. Upload a CSV to add recipients.
Summary
The NPS Setup module provides all functionality required to configure and distribute NPS surveys. Administrators can create multilingual surveys, manage survey questions, customize invitation emails, import recipient lists, and distribute invitations from a centralized interface. The module supports the complete survey lifecycle, from initial configuration through recipient management and email delivery.
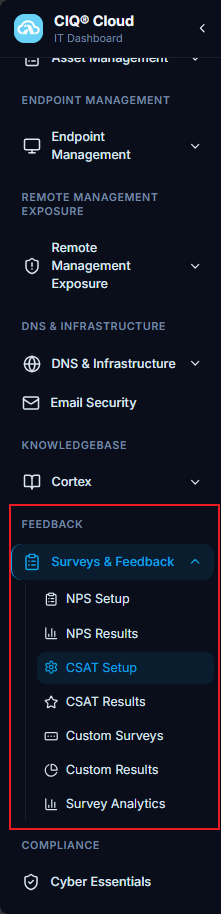
Navigation
Overview
The CSAT Setup page allows administrators to configure the Customer Satisfaction (CSAT) survey presented to customers after support ticket completion. This functionality enables organizations to customize survey branding, configure customer-facing messages, define available languages, generate survey URLs, and integrate survey links with PSA and ticketing systems.
The module supports customer feedback collection while providing integration capabilities for automated survey distribution through supported PSA platforms.

Navigation
CIQ Home > Surveys & Feedback > CSAT Setup
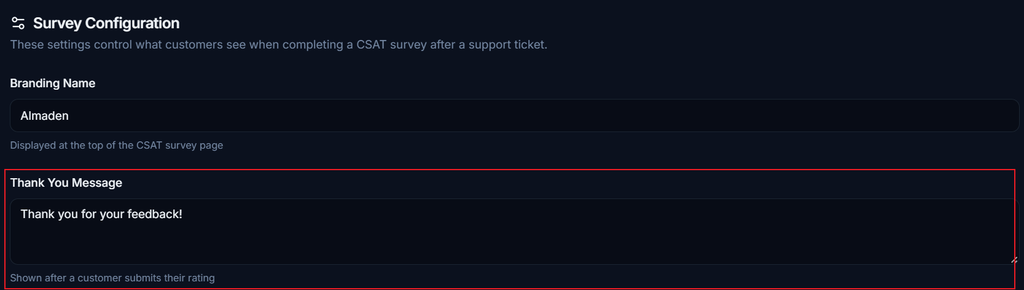
Survey Configuration
The Survey Configuration section allows administrators to define how the customer satisfaction survey is presented to end users.
Branding Name
Defines the organization name displayed at the top of the CSAT survey.
The configured value is displayed as the survey brand identifier visible to customers when accessing the survey.

Thank You Message
Defines the message displayed after a customer submits a survey response.
This message confirms that the feedback has been successfully received.
Survey Languages
Defines which languages are available to customers when accessing the survey.

Observed Options
- English
- Español
- Français
- Português
Multiple languages can be enabled simultaneously.
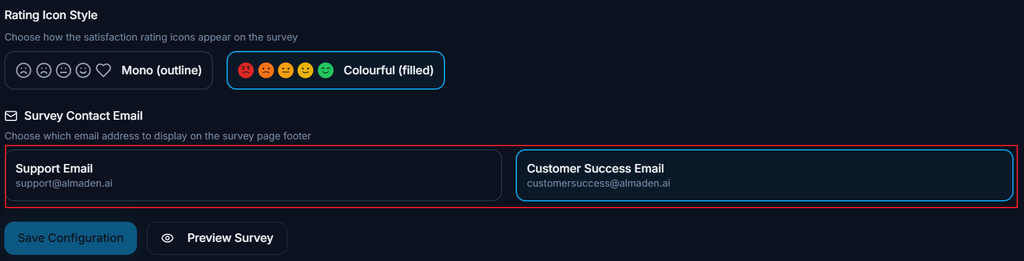
Rating Icon Style
Defines how satisfaction ratings are displayed within the survey.

Observed Options
- Mono (outline)
- Colourful (filled)
Mono (outline)
Displays rating icons using outlined monochrome symbols.
Colourful (filled)
Displays rating icons using colored symbols representing different satisfaction levels.
Survey Contact Email
Defines the contact information displayed within the survey footer.
Support Email
Displays the support contact email address.
This address can be used by customers requiring technical assistance.
Customer Success Email
Displays the customer success contact email address.
This address can be used by customers seeking account-related assistance or service guidance.
Actions
Save Configuration
Saves the current survey configuration.

Preview Survey
Opens a preview of the customer satisfaction survey using the currently configured settings.
Survey Link
The Survey Link section generates the survey URL that will be distributed to customers.
The generated URL can be incorporated into email templates, ticket notifications, and PSA workflows.
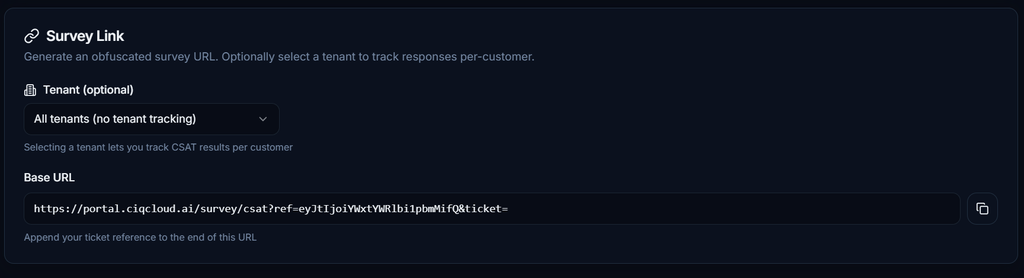
Tenant (Optional)
Allows the survey URL to be associated with a specific tenant.
Observed Values
- All tenants (no tenant tracking)
- Selected tenant
When a tenant is selected, survey responses can be associated with the corresponding customer organization.
Base URL
Displays the generated survey URL.
The URL serves as the base survey address and can be copied for use within automated communications.
A ticket reference should be appended to the end of the URL before distribution through PSA systems.
Copy URL
Copies the generated survey URL to the clipboard.
PSA Integration
The PSA Integration section provides guidance and platform-specific examples for integrating CSAT surveys with PSA and ticketing systems.
The survey URL can be embedded within automated ticket closure notifications to collect customer feedback.
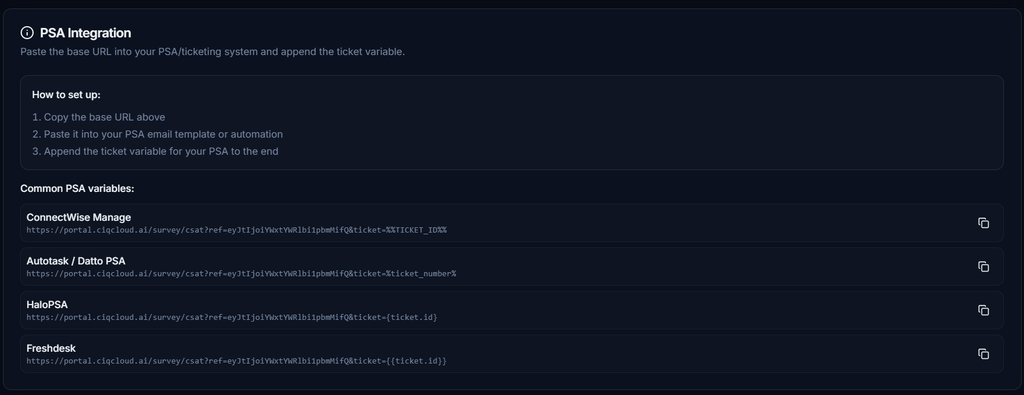
How to Set Up
- Copy the generated Base URL.
- Paste the URL into a PSA email template or automation workflow.
- Append the appropriate ticket variable supported by the PSA platform.
Common PSA Variables
The platform provides example ticket variables for commonly supported PSA solutions.
ConnectWise Manage
Appends the ConnectWise ticket identifier variable to the survey URL.
Example: …&ticket=%TICKET_ID%
Autotask / Datto PSA
Appends the Autotask ticket number variable to the survey URL.
Example: …&ticket=%ticket_number%
HaloPSA
Appends the HaloPSA ticket identifier variable to the survey URL.
Example: …&ticket={{ticket.id}}
Freshdesk
Appends the Freshdesk ticket identifier variable to the survey URL.
Example: …&ticket={{ticket.id}}
Copy Example:
Copies the displayed integration example to the clipboard.
Summary
The CSAT Setup module centralizes customer satisfaction survey configuration and distribution. Administrators can customize survey appearance, configure multilingual support, define customer contact information, generate survey links, and integrate surveys with PSA platforms to automatically collect feedback after ticket completion.
CSAT Results
Overview
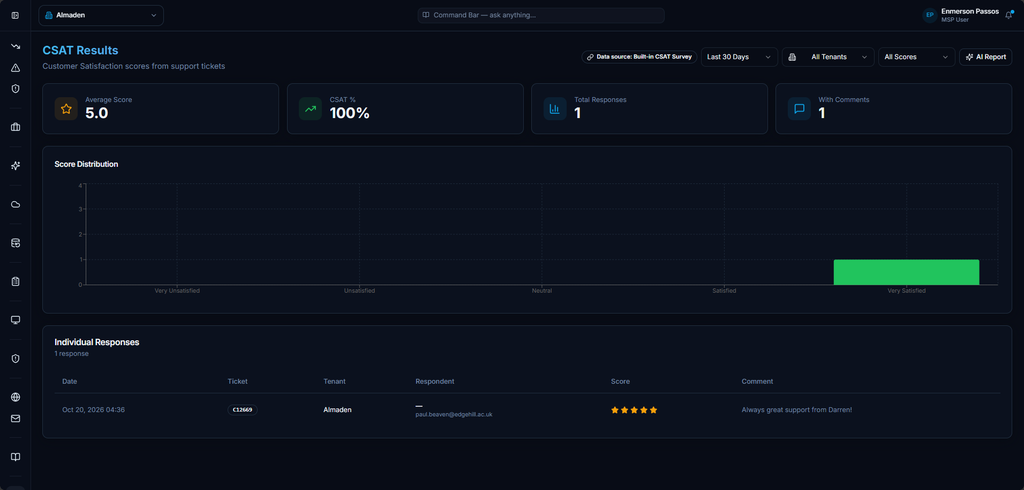
The CSAT Results page provides visibility into customer satisfaction survey responses collected from support tickets. The page displays overall satisfaction metrics, score distribution, and detailed survey responses, allowing administrators to monitor customer feedback and evaluate service performance.
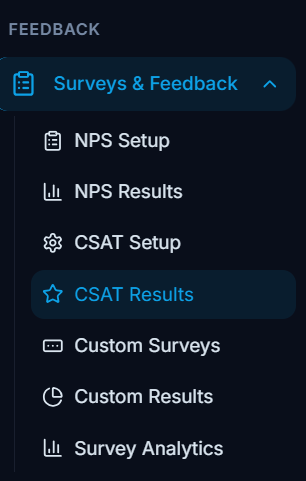
Navigation
Reporting → CSAT Results
Filters
The filters located at the top of the page allow users to refine displayed survey results.

| Field | Description |
|---|---|
| Data Source | Defines the survey source used for reporting. |
| Date Range | Filters results by a selected time period. |
| Tenant | Filters results by tenant. |
| Score | Filters results by satisfaction score. |
| AI Report | Generates an AI-based analysis of the survey data. |
Summary Metrics
The summary section displays key CSAT performance indicators.

| Metric | Description |
|---|---|
| Average Score | Displays the average survey rating received. |
| CSAT % | Displays the overall customer satisfaction percentage. |
| Total Responses | Displays the total number of survey responses collected. |
| With Comments | Displays the number of responses that include customer comments. |
Score Distribution
The Score Distribution chart displays the number of survey responses received for each satisfaction level.

Available Categories
- Very Unsatisfied
- Unsatisfied
- Neutral
- Satisfied
- Very Satisfied
The chart provides a visual representation of customer satisfaction trends across all collected survey responses.
Individual Responses
The Individual Responses section displays detailed information for each submitted survey.

| Column | Description |
|---|---|
| Date | Date and time the survey response was submitted. |
| Ticket | Associated support ticket reference. |
| Tenant | Tenant associated with the ticket. |
| Respondent | Email address of the survey respondent. |
| Score | Customer satisfaction rating submitted. |
| Comment | Customer feedback provided with the survey response. |
Response Details
Each record contains the complete survey submission, including the associated support ticket, submitted rating, and any customer comments.
The displayed score uses a five-star rating system, allowing users to quickly identify satisfaction levels and review related feedback.
Actions
AI Report
Generates an AI-powered analysis of the currently filtered survey data.
The report provides additional insights based on customer feedback and satisfaction trends.
Summary
The CSAT Results page centralizes customer satisfaction reporting by providing summary metrics, score distribution analysis, individual survey responses, and AI-generated insights. This enables organizations to monitor customer sentiment and evaluate service quality based on collected CSAT survey data.
Custom Surveys
Overview
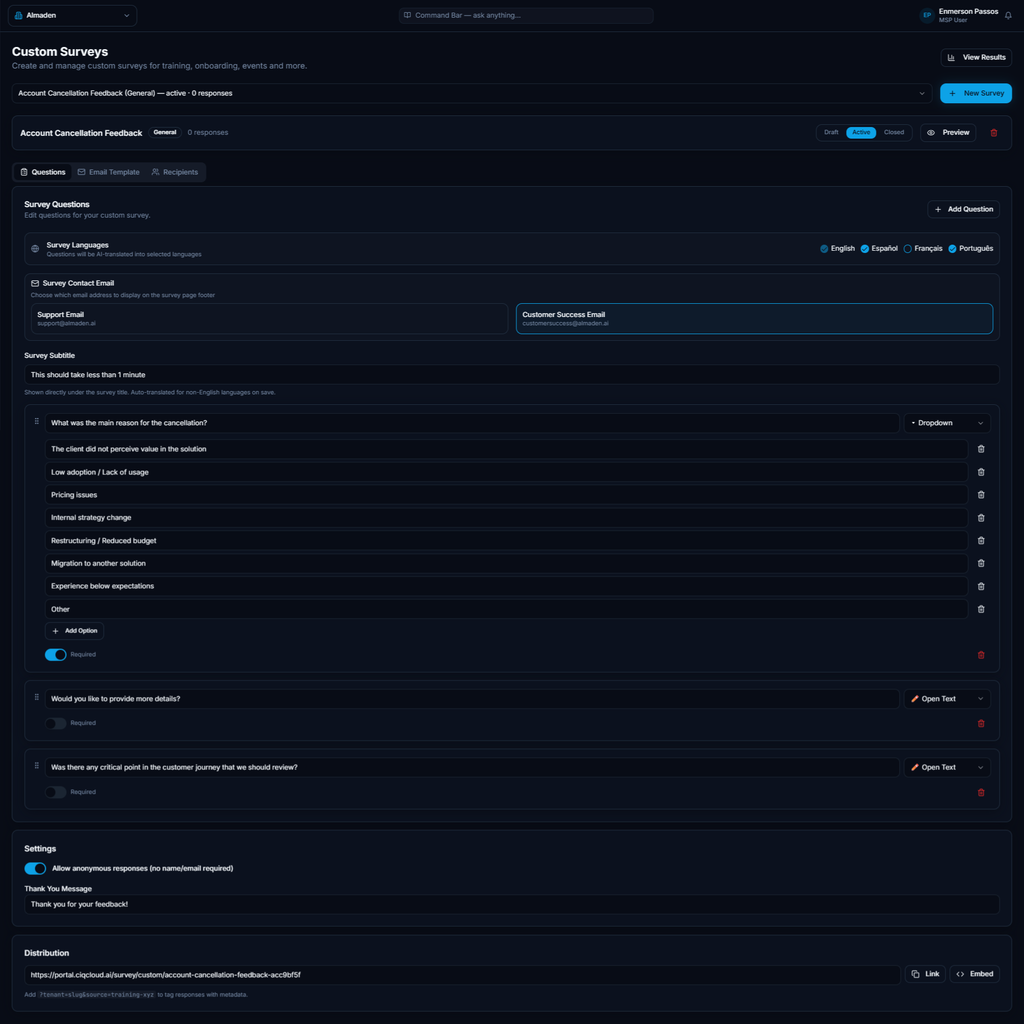
The Custom Surveys page allows administrators to create and manage custom surveys for activities such as customer feedback, onboarding, training, events, and service reviews. The page provides tools for configuring survey questions, managing recipients, customizing email templates, defining response settings, and distributing survey links.
Navigation
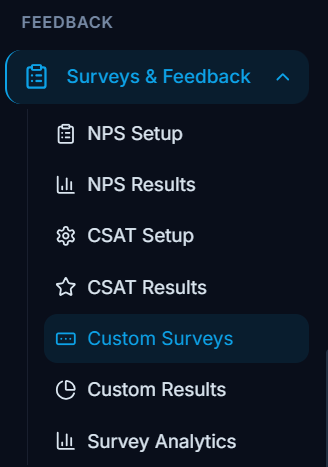
Customer Experience → Custom Surveys
Survey Management
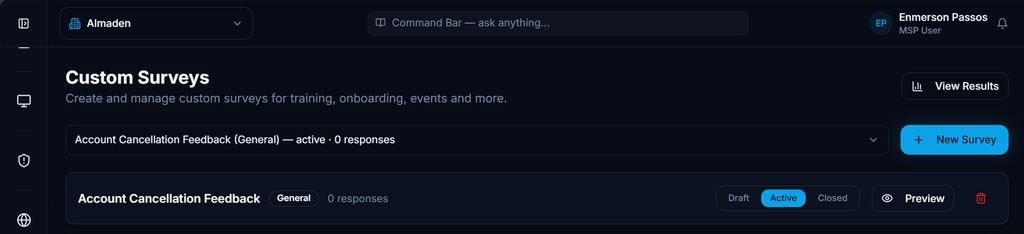
The top section of the page provides controls for managing surveys.
| Item | Description |
|---|---|
| Survey Selector | Displays the currently selected survey and response count. |
| New Survey | Creates a new custom survey. |
| View Results | Opens the survey results page. |
| Status | Defines the survey state. |
| Preview | Opens a preview of the survey. |
| Delete | Removes the survey. |
Survey Status
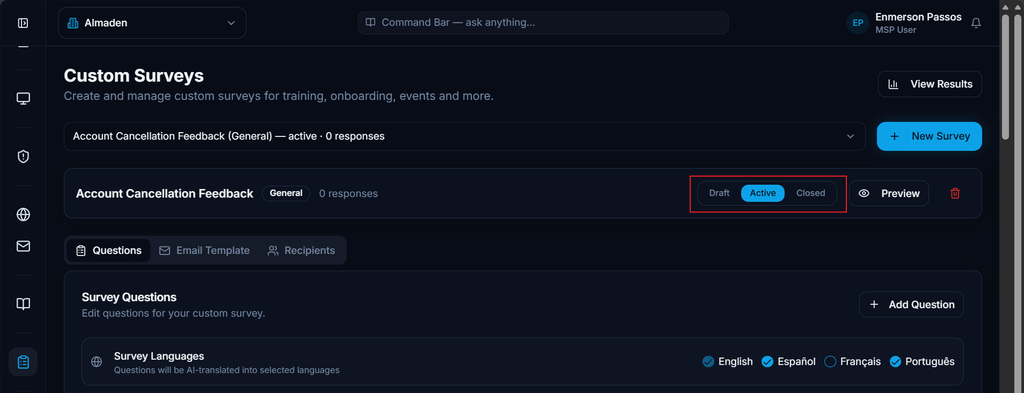
The following statuses are available:
- Draft
- Active
- Closed
Only one status can be active at a time.
Survey Tabs
The survey configuration is organized into multiple tabs.
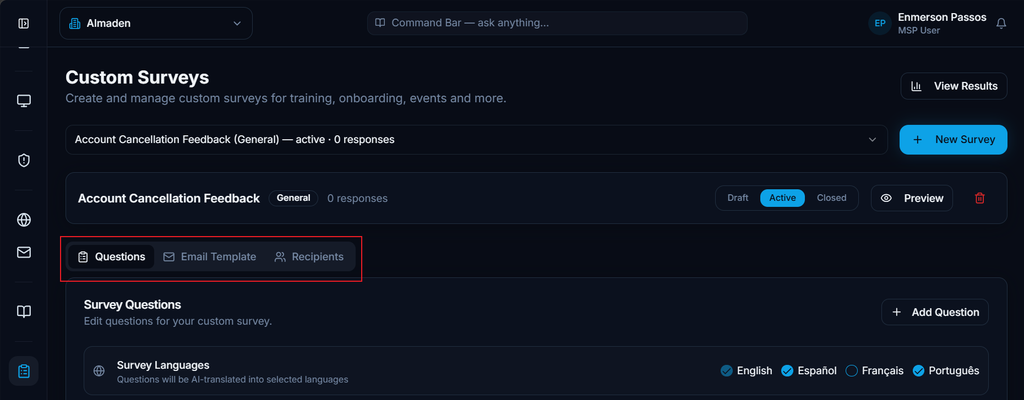
| Tab | Description |
|---|---|
| Questions | Configure survey questions and settings. |
| Email Template | Configure the survey invitation email. |
| Recipients | Manage survey recipients. |
Questions
The Questions tab allows administrators to build and manage survey questions.
Survey Languages
Defines the languages available for the survey.
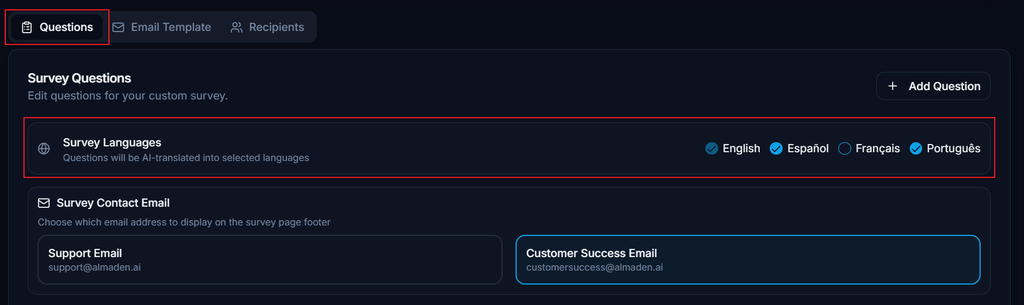
Available Languages
- English
- Español
- Français
- Português
Questions will be automatically translated into the selected languages.
Survey Contact Email
Defines the contact information displayed in the survey footer.
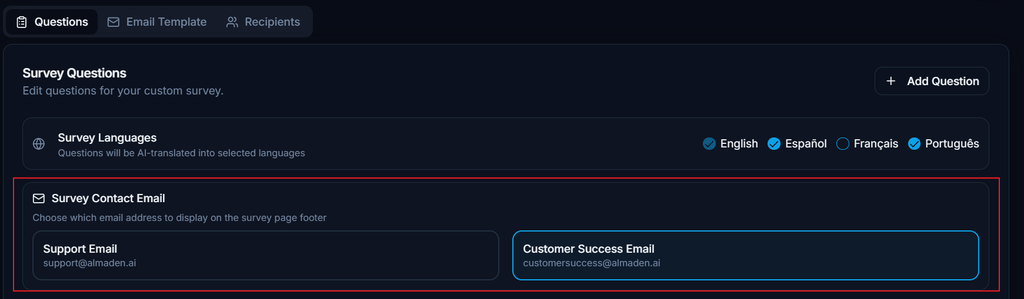
Support Email
Displays the support contact email address.
Customer Success Email
Displays the customer success contact email address.
Survey Subtitle
Defines the text displayed directly below the survey title.

Example:
This should take less than 1 minute
The subtitle provides additional guidance or context for survey participants.
Survey Questions
The page displays each survey question as an individual configuration block.
Question Types

The following question types are visible in the interface:
| Type | Description |
|---|---|
| Dropdown | Allows selection from predefined options. |
| Open Text | Allows respondents to enter free-text responses. |
Dropdown Question
Question
What was the main reason for the cancellation?
Available Options
- The client did not perceive value in the solution
- Low adoption / Lack of usage
- Pricing issues
- Internal strategy change
- Restructuring / Reduced budget
- Migration to another solution
- Experience below expectations
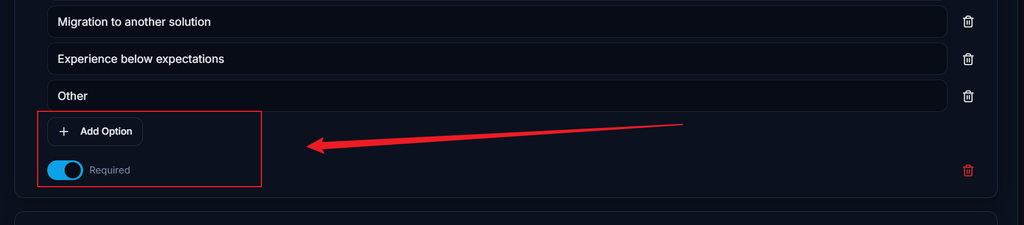
Add Option
Adds additional answer options to the question.
Required
Marks the question as mandatory.
Open Text Question

Question
Would you like to provide more details?
Allows respondents to enter additional comments.
Required
Marks the question as mandatory.
Settings
The Settings section controls survey behavior.

Allow Anonymous Responses
When enabled, respondents can submit survey responses without providing identifying information.
Option
Allow anonymous responses (no name/email required)
Thank You Message
Defines the message displayed after a survey response is submitted.
Example:
Thank you for your feedback!
Distribution
The Distribution section provides access to the survey URL.

Survey URL
Displays the unique survey link generated for the selected survey.
The URL can be used for direct survey distribution.
Link
Copies the survey URL to the clipboard.
Embed
Generates embed code for integrating the survey into external platforms or websites.
Actions
| Action | Description |
|---|---|
| Add Question | Adds a new question to the survey. |
| Preview | Opens a survey preview. |
| Save Changes | Stores survey updates. |
| Copy Link | Copies the survey URL. |
| Embed | Generates survey embed code. |
| View Results | Opens survey reporting and response data. |
Summary
The Custom Surveys page provides a centralized location for creating, configuring, and distributing custom surveys. Administrators can build multilingual surveys, configure question types, manage response requirements, enable anonymous participation, customize post-submission messages, and distribute surveys through direct links or embedded integrations.
Survey Results
Overview
The Survey Results page allows users to view and analyze responses submitted through custom surveys. Users can select a survey from the available list to access its collected responses and related survey data.

Navigation
Customer Experience → Survey Results
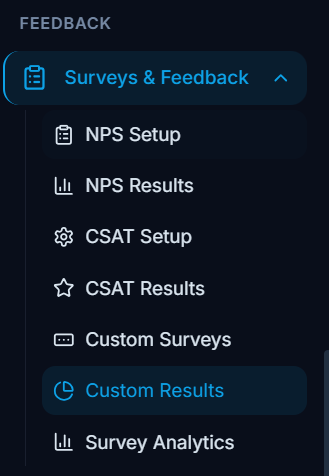
Survey Selection
The survey selector allows users to choose which survey results to view.
Only one survey can be selected at a time.
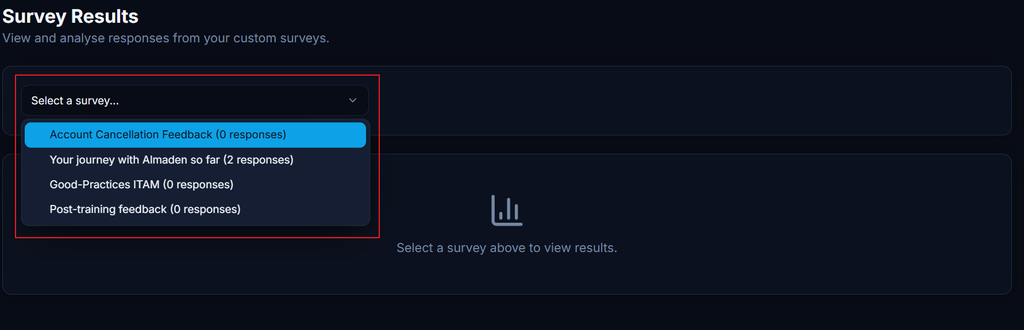
Available Surveys
The list displays all available surveys along with their response counts.
Examples shown:
- Account Cancellation Feedback (0 responses)
- Your journey with Almaden so far (2 responses)
- Good-Practices ITAM (0 responses)
- Post-training feedback (0 responses)
The number displayed beside each survey represents the total responses received for that survey.
Results Viewer
The main results panel displays survey response information for the selected survey.
When no survey is selected, the page displays a placeholder message indicating that a survey must be selected before results can be viewed.
Empty State
Select a survey above to view results.
This message is displayed when no survey data is currently loaded.
Response Counts
Each survey displays the total number of collected responses.
| Item | Description |
|---|---|
| Survey Name | Name of the custom survey. |
| Response Count | Total number of responses submitted for the survey. |
Actions
Select Survey
Loads the results associated with the selected survey.
Once selected, the page displays the available response data for that survey.
Summary
The Survey Results page provides a centralized location for accessing response data collected from custom surveys. Users can select a survey from the available list, review response counts, and access survey result information for further analysis.
Survey Analytics
Overview
The Survey Analytics page provides consolidated reporting across customer feedback surveys, including NPS, CSAT, and Custom Surveys. The dashboard presents response volumes, score summaries, survey distribution, and overall survey activity within a selected reporting period.

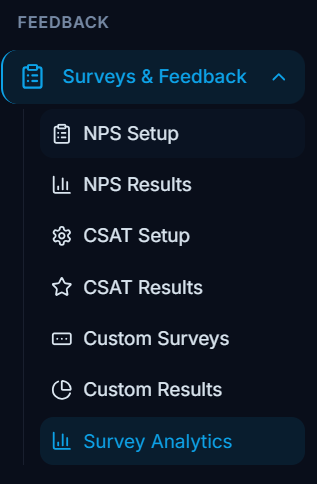
Navigation
Analytics → Survey Analytics
Filters
The reporting period selector allows users to control the timeframe used for all analytics displayed on the page.
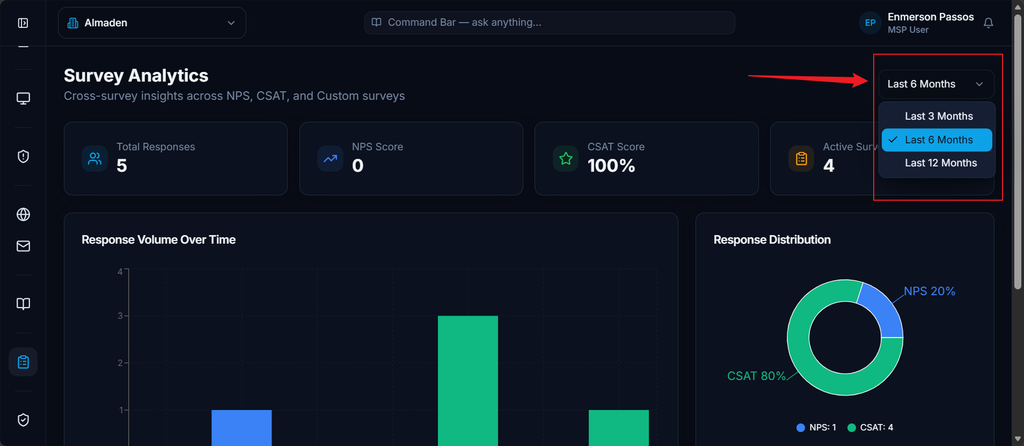
| Field | Description |
|---|---|
| Date Range | Filters analytics data based on the selected reporting period. |
Available Example:
Last 6 Months
Summary Metrics
The summary section displays key survey performance indicators.
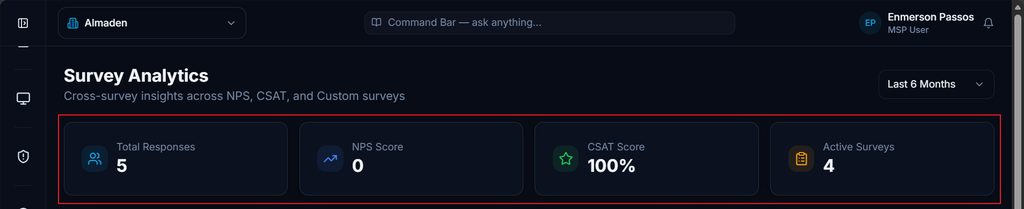
| Metric | Description |
|---|---|
| Total Responses | Total survey responses collected across all survey types. |
| NPS Score | Current Net Promoter Score calculated from NPS surveys. |
| CSAT Score | Current Customer Satisfaction score calculated from CSAT surveys. |
| Active Surveys | Total number of active surveys. |
Response Volume Over Time
The Response Volume Over Time chart displays the number of survey responses received during the selected reporting period.
The chart allows users to identify participation trends and measure survey activity over time.
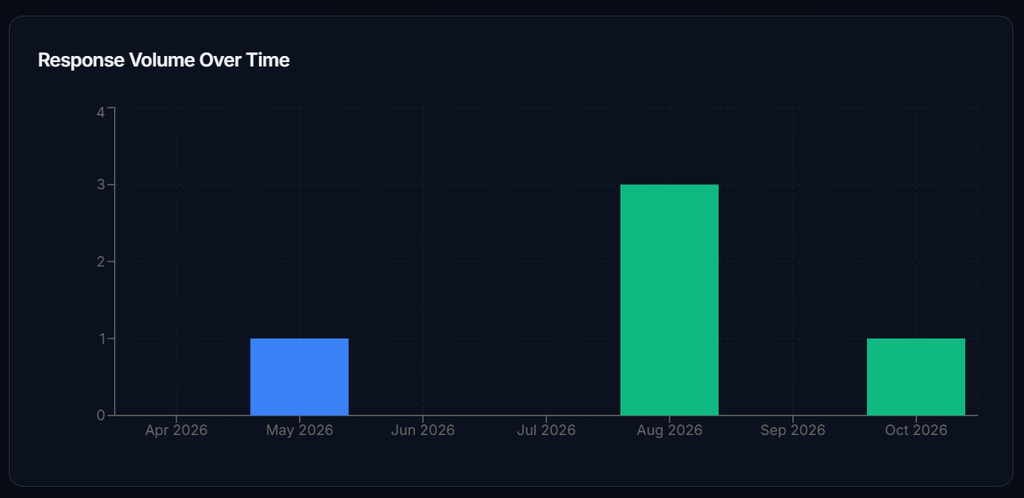
Chart Information
| Element | Description |
|---|---|
| Time Axis | Displays response activity by month. |
| Response Count | Displays the number of responses received during each period. |
| Survey Sources | Combines responses from supported survey types. |
Response Distribution
The Response Distribution chart displays the proportion of responses collected from each survey type.
The chart provides a visual breakdown of survey participation across available survey categories.

Survey Types
| Survey Type | Description |
|---|---|
| NPS | Net Promoter Score surveys. |
| CSAT | Customer Satisfaction surveys. |
The distribution percentage represents each survey type’s contribution to the total response volume.
Score Summary
The Score Summary section provides a consolidated view of survey performance by survey type.

| Metric | Description |
|---|---|
| NPS | Displays the calculated NPS score and total responses. |
| CSAT | Displays the calculated CSAT percentage and total responses. |
This section allows users to compare survey performance across different feedback programs.
Analytics Components
| Component | Description |
|---|---|
| Total Responses | Displays overall survey participation. |
| NPS Score | Displays the current NPS result. |
| CSAT Score | Displays the current CSAT percentage. |
| Active Surveys | Displays the number of active surveys. |
| Response Volume Over Time | Displays response trends over time. |
| Response Distribution | Displays survey type distribution. |
| Score Summary | Displays summarized performance metrics. |
Summary
The Survey Analytics page provides a centralized view of customer feedback performance across NPS, CSAT, and custom survey programs. The dashboard enables users to monitor response volume, track satisfaction metrics, analyze survey distribution, and evaluate overall engagement through consolidated reporting and visual analytics.
